Tests of Change: Simulated Design of Experiments in Healthcare Delivery
July / August 2009
![]()
Tests of Change:
Simulated Design of Experiments in Healthcare Delivery
Hospital administrators and quality department personnel seeking to improve hospital processes often find
it difficult to implement change. This is true especially when recommended changes potentially are highly disruptive, directly affect patient quality of care, or must be tested in a trial-and-error approach. The risk aversion that arises from past failed attempts and lack of confidence in the success of proposed changes exacts a significant toll on continuous improvement efforts.
In industries where design and modification of products and processes is routine (e.g., as in research and development, product development), an approach called design of experiments (DOE) is used to manage product and process improvements. DOE is a stepwise method based on statistics, which efficiently guides the identification and selection of changes that collectively will optimize performance. Typically, this involves iterative testing of different factors, settings and configurations, using the results of successive tests to further refine the product or process. When properly done, a DOE approach produces more precise results while using many fewer experimental runs than other methods (e.g., one factor at a time, or trial and error). The outcome is a robust design that better meets customer specifications and production and delivery constraints.
A designed, experimental approach is not new to healthcare. For example, medical researchers use a carefully designed series of experiments to optimize medical devices and drug formulations. However, DOE most often is applied to physical processes, where it is relatively straightforward to think in terms of “factors” (such as temperature, pressure, concentration, material) and discrete “factor levels” (100ºC, 50 psi, 1 mg/ml, coated/uncoated). Much less frequently, it is used for business process improvement that typically involves factors that are less easily quantified (but not impossible; consider examples such as human behaviors, patient satisfaction, acuity). Additionally, although DOE is an excellent tool to manage testing of multiple, difficult, risky, or expensive configurations, the norm for managing in healthcare is via expert opinion and consensus, followed by and trial and error. As examples, consider how emergency department staffing levels typically are established, or the process of patient medical diagnosis with consults and a progression of treatments until an effective remedy is found (Neuhauser 2005). In a comprehensive literature search conducted in 2005, Olsson et al. reported finding only three articles that discussed the use of DOE in a healthcare delivery setting.
Increasingly, however, user-friendly simulation and statistical software provide a viable means of using DOE to test configurations (called scenarios in simulation terminology) with computer simulations to help eliminate options that are unlikely to work and identify those with a high probability of success. For example, Baesler et al. (2003) created a discrete event simulation model to estimate maximum demand in the emergency room of a private hospital in Chile that would still allow patients to have a length of stay (“time in system”) at or below a 100-minute threshold. After finding this demand level (130% of current), the investigators tested via simulated DOE different numbers of resources (receptionist, physician, paramedic, exam room at “low” and “high” levels) to determine the optimal mix of these at 130% of demand based on patient length of stay. Other examples and an introduction to the application of DOE in healthcare can be found in Sloan (1996).
At a high level, a simulated DOE method consists of the following steps:
- Create a process flow model depicting the activities and participants in the process.
- Identify the process output(s) of interest and target value(s).
- Identify the input(s) to be tested for their effect(s) on the output(s).
- Select the combinations of inputs to be tested as different scenarios.
- Run the process flow simulation with the different scenarios.
- Analyze the results using DOE.
- Identify the scenario(s) that perform best against the output target(s) and draw practical conclusions regarding proposed process improvements.
Several iterations may be needed to refine and test scenarios before converging on a final configuration or small number of alternatives to test in actual operations.
Below are examples of questions that this approach of simulated DOE could address in a healthcare delivery setting:
Staffing
- How many emergency department RNs are needed to maintain patient average length of stay around 120 minutes and simultaneously minimize labor costs across a range of anticipated patient arrival rates?
- What mix of clerical and clinical resource skill levels optimizes emergency department door-to-doc time?
- Will the addition of one radiologist be worth the extra cost in terms of turnaround time? Should any additional radiologist be dedicated to the emergency department?
Bed Allocation
- How many inpatient beds of different types (e.g., medical/surgical, adult intensive care (ICU), burn ICU) will yield an overall 75% utilization?
- Would patient flow improve if one of the emergency department triage rooms were converted into an exam room?
Emergency Department Flow
- On what days of the week should a Fast Track process be in operation to minimize patient waiting room time, and should RN and physician resources be dedicated to the Fast Track process when it is in operation?
- How would partial conversion of incoming patient waiting room space into a treated patient holding area impact exam room utilization and rate of patients leaving without being seen? Should such a holding area only operate under high patient volume?
The first example above of a hypothetical emergency department staffing problem is expanded in more detail below to better illustrate the concept and high-level process steps to complete a simulated DOE. The explicit steps, mathematical and statistical aspects of “how” to construct, run and analyze a complete simulated DOE are beyond the scope of this paper.
Question: How many emergency department RNs are needed to maintain patient average length of stay around 120 minutes and simultaneously minimize labor costs across a range of anticipated patient arrival rates?
- Process flow model. As an initial step, a process flow model would be created to represent the typical flow, durations of activities, assignment of resources to activities, and schedules (not shown here).
- Output(s). Patient average length of stay (ALOS, minutes); labor costs per patient (calculated at $30/hour).
- Inputs. Number of RNs (Factor 1), Patient arrivals per day (Factor 2).
- Scenarios. Each factor can be tested at multiple levels; for this example we will choose only two levels, designated as low and high. Testing both factors at both levels yields 2×2 or 4 possible scenarios (this is called a full factorial DOE)(Table 1).
- Run the process flow simulation. Runs with specific low and high input values might lead to the following results (Table 2).
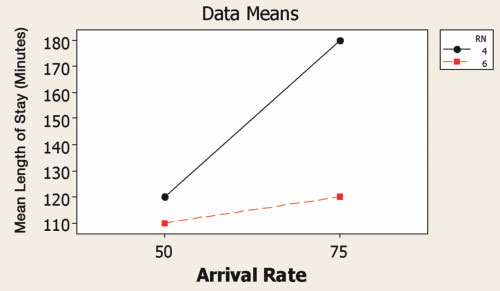
- Analyze the results using DOE. Analysis using Minitab® shows that both the number of nurses and arrival rate are associated with the patient length of stay and labor cost (Figure 1). However, there is an interaction such that the effect of additional nurses is greater at the higher arrival rate (Figure 2). Optimization plots (Fig. 3, page 38) reveal that four RNs are sufficient to minimize labor costs yet still meet the 120 minute length of stay target at the low arrival rate of 50 patients per day. As arrival rates increase to 75 patients per day, the number of nurses required increases to six in order to meet the length of stay target. The greatest ALOS and labor costs per patient occur at intermediate arrival rates.
- Identify scenarios and draw conclusions. In this simplified example, we may conclude that to simultaneously meet the ALOS and labor cost requirements (and assuming only full-time RNs are considered), four nurses are recommended at the low arrival rate of 50 patients per day. Five nurses are suggested with arrivals between 50 and 61 patients per day, and six nurses between 61 and 75 patients per day. These conclusions should be verified by re-running the simulation model, and the selected staffing levels piloted in real life before full implementation.
| Scenario | Factor 1 Number of RNs |
Factor 2 Patient Arrivals per day |
| 1 | Low | Low |
| 2 | High | Low |
| 3 | Low | High |
| 4 | High | High |
Table 1.
| Scenario | Factor 1 Number of RNs |
Factor 2 Patient Arrivals per day |
Patient average length of stay (minutes) |
Labor cost per patient (USD) |
| 1 | Low (4) | Low (50) | 120 | $57.60 |
| 2 | High (6) | Low (50) | 110 | $86.40 |
| 3 | Low (4) | High (75) | 180 | $38.40 |
| 4 | High (6) | High (75) | 150 | $57.60 |
Table 2.
(1a) Main Effects Plot for LOS
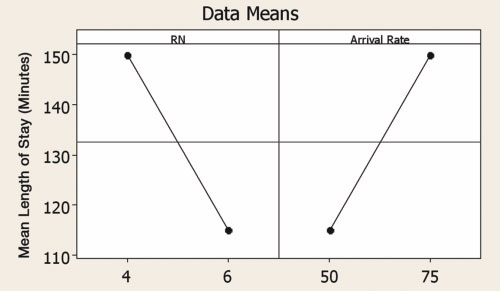
(1b) Main Effects Plot for Labor Costs
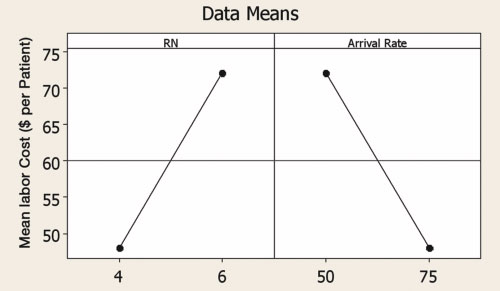
Figure 1. Main effects of RN number and patient arrival rate per day on patient length of stay (a) and labor cost (b). In DOE, a “main effect” is the effect of any single factor without regard to any other factors. The non-zero slopes of the lines indicate a main effect of the individual factors. In Fig. 1a, as the number of RNs increases, LOS decreases. Conversely, as arrival rate increases, LOS also increases. In Fig. 1b, labor costs per patient have opposite trends to LOS, illustrating the conflict inherent to simultaneously keeping both LOS and labor costs down.
(2a) Interaction Plot for LOS
(2b) Interaction Plot for Labor Costs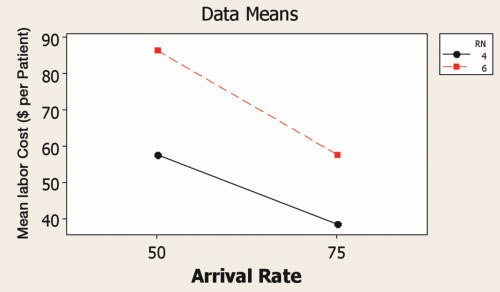
Figure 2. Interaction between number of RNs and patient arrival rate per day in terms of patient length of stay (a) and labor cost (b). In DOE, an interaction is the effect of more than one factor acting together such that the outcome is greater or less than the simple sum of the main effects of the factors. The non-parallel lines indicate that the effect of number of nurses is greater at the higher arrival rate. The practical implication is that staffing levels need to be more carefully managed at higher patient volumes.
It is important to note that considering the competing demands of the patients (ALOS) and business (labor costs) individually would lead to different conclusions than when treated simultaneously. If staffing were evaluated based only on ALOS and without the cost constraint, five nurses would be recommended at a much lower arrival rate of 53 patients per day. Similarly, if labor cost were the only consideration, then four nurses would be acceptable across all arrival rates. Either would have produced an unfavorable result if put into practice, with either excessive length of stay, or excessive costs.
Several advantages are evident in the application of simulated DOE to healthcare delivery:
- Predictions are possible for situations that do not necessarily exist. In the emergency department staffing example, the higher arrival rates need not have been experienced in real life (although any extrapolation outside the bounds of actual observations must be done with caution).
- Solutions that would be very difficult, disruptive, or risky to test under real life conditions easily can be tested. In the example, it would be difficult or impossible to adjust the arrival rates of patients.
- Interactions can be identified and taken into consideration when making process improvements. The DOE approach specifically allows for the testing of both main effects and interactions. In the example, the effect of adding nurses was greater at the higher patient arrival rates. At the same time, the effect of variation in arrival rate was much greater with four RNs than with six RNs. These intuitively make sense, but can be quantified by DOE.
- Many different configurations can be tested in a very short period of time. Once the initial process flow model is created, scenarios are relatively straightforward to set up and test. Answers that normally would take many days or weeks to obtain can be acquired in a matter of hours.
There are several downsides to this approach. First, building a discrete event simulation is tedious, time-consuming, and often requires data that may not readily be available. The data can be acquired with some planning, however, and once a model is built it can be put to many uses. Second, neither simulation nor DOE are widely used in healthcare, and the approach may be treated with suspicion. To alleviate this, engage the assistance of experts, and always pilot changes in a protected environment before fully implementing. Despite these drawbacks, the potential benefits warrant a closer look at simulated DOE for hospital process improvement.
 (3a) At a low arrival rate of 50 patients per day, four RNs achieve the 120 minute LOS target, with labor cost of $57.60/patient. Note that as RN number increases from four to six that LOS decreases while Labor Costs increase, with an overall, net effect of decreasing desirability with increasing number of RNs (see Composite Desirability plot; the increase in labor costs exceeds the gain in reduction in LOS). As arrival rate increases from 50 to 75 patients, LOS increases while Labor Costs per patient decrease, with a net effect of decreasing desirability as arrival rates increase (the increase in LOS exceeds the reduction in labor costs per patient).
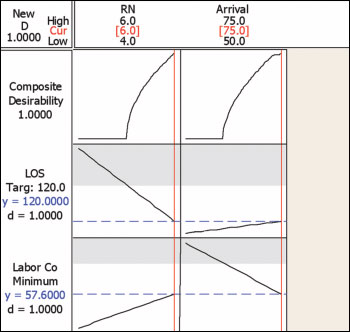 (3b) At the high arrival rate of 75 patients per day, six RNs are required to achieve the 120 minute LOS target; labor costs are held at $57.60 per patient. Note that as RN number increases from four to six that LOS decreases while Labor Costs increase. However, unlike the scenario in Figure 3a, the benefit of lower LOS outweighs the increase in Labor Cost per patient, such that the overall, Composite Desirability favors the higher number of RNs. Similarly, as arrival rate increases from 50 to 75 patients, LOS increases while Labor Costs per patient decrease, with a net effect of increasing desirability as arrival rates increase.
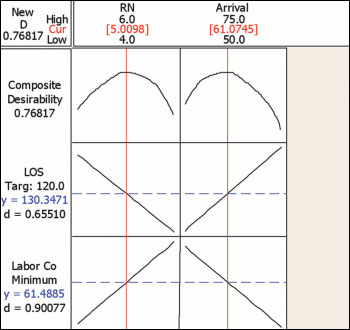 (3c) At intermediate arrival rates, between four and six RNs are needed (note the Composite Desirability curves that peak at intermediate RN level and arrival rates). Between arrival rates of 50 and 61 patients per day, fractional (e.g., part time) RNs are needed above four to stay close to the 120 minute LOS target. At 61 patients per day, five RNs provide the best balance between increasing LOS and increasing labor costs. Between 61 and 75 patients per day, fractional RNs between five and six provide the best solution to keep LOS near its target, and labor costs low.
Conclusions
The combination of simulation and DOE provides a powerful approach to the design, testing and improvement of hospital processes. Although DOE frequently is used in other industries, it remains underutilized in healthcare. Integrating DOE with simulation helps address some of the perceived problems in applying DOE within the constraints of healthcare delivery settings. Although any configuration identified by DOE should still be tested in real life before final implementation, there is much greater confidence in the solution than without any testing, and much less disruption, time expenditure, and risk than with less structured and potentially statistically unsound methods.
Brian Stockhoff is a senior consultant with Juran Institute, Inc. As an ASQ-certified Six Sigma Black Belt, Stockhoff combines knowledge of statistics, process optimization, and project management to reduce defects and cycle time in business processes while improving customer focus. He has more than 16 years of experience working across a broad range of operations in service, manufacturing, and healthcare organizations. Stockhoff holds two bachelor degrees from Penn State University, an MBA from the University of Phoenix, and a PhD in biology from The University of Michigan. He has published 15 papers in scientific and legal disciplines and is an inventor on 20 issued U.S. patents. He has been a periodic guest lecturer for the Biomedical Product Development program at the University of California, San Diego. Stockhoff may be contacted at bstockhoff@juran.com.
References
Baesler F. F., Jahnsen H. E., & DaCosta, M. (2003). The use of simulation and design of experiments for estimating maximum capacity in an emergency room. Proc. 2003 Winter Simulation Conf.; S. Chick, P.J. Sánchez, D. Ferrin, D.J. Morrice (Eds.). 1903-1906.
Neuhauser, D. (2005). Why design of experiments just may transform health care. Quality Management in Health Care 14(4):217-218.
Olsson, J., Terris D. (2005). The One-Person Randomized Controlled Trial. Quality Management in Health Care, 14(4), 206-216.
Sloan, M.D., (1996). Using designed experiments to shrink health care costs. Milwaukee: ASQ Quality Press.