Revisiting the Perinatal Adverse Outcome Index
May/June 2011
Revisiting the Perinatal Adverse Outcome Index
The challenge of sorting through copious amounts of data to find the essential information is not new. Over the years, various professions have developed key markers to highlight the essential. For example, clinicians use vital signs, accountants have bottom lines, and journalists pen pithy headlines. Perinatal safety professionals grapple with complex systems and also desire a succinct summary to measure the impact of their programs. The Adverse Outcome Index (AOI) and its cousins the Weighted Adverse Outcome Score (WAOS) and Severity index (SI), are composite scores that were designed to measure quality of perinatal care (Mann et al., 2006; Nielsen et al., 2007; Pettker et al., 2009). While a simple numerical score is enticing, the AOI only partially answers the three key questions that safety professionals must ask: Did clinicians do what they were supposed to do? Did it make a difference? Was there a plausible link between the intervention and outcome?
Epidemiologists are quick to point out that the clustered prospective randomized clinical trial is the best method to determine a solid relationship between intervention and outcome. Sometimes such trials are not possible because rare perinatal events require an extraordinarily large sample size so that researchers may draw conclusions with confidence or such trials may even be unethical if an accepted standard of care were to be withheld. While a cause-and-effect relationship can never be proven in an observational study, such studies can be helpful with the caveat that sufficient additional information is provided in order to judge the plausibility of the link.
The purpose of this report is to describe the history of the AOI concept, demonstrate limitations in the AOI construct, and suggest alternative approaches to better understand the impact of safety interventions.
History of the AOI
The AOI was first created by a research team studying the impact of team training in the labor and delivery environment. Team training was expected to reduce the occurrence of medical errors and adverse outcomes associated with medico-legal liability and was not targeted to any specific obstetric outcome. The study was funded by the Department of Defense, the Risk Management Foundation of the Harvard Medical Institutions, and the Beth Israel Deaconess Medical Center Foundation and involved 15 hospitals. Consensus conferences involving medical and nursing leaders from participating hospitals identified 10 adverse obstetrical events that were considered modifiable with implementation of team training. Because the frequency of each individual event was low, a composite measure reflecting the 10 adverse outcomes was considered to be appropriate (Mann et al., 2006). Grouping these outcomes together resulted in a composite outcome that was more common and lessened the need for excessively large study populations. The AOI, however, included items with vastly different clinical importance, for example maternal death and perineal laceration. To attempt to equalize the contribution of such disparate items, a consensus process created individual weighting factors for each adverse event. Maternal death was considered the most severe event and carried a weight of 750. The sum of the weights of the other nine adverse events also equalled 750, with perineal laceration having the lowest weighted value as shown in Table 1. Obtaining consensus on a set of obstetrical measures (outcome and weights) that were acceptable to a wide range of key stakeholders was a considerable accomplishment but does not necessarily mean that they are either valid or reliable.
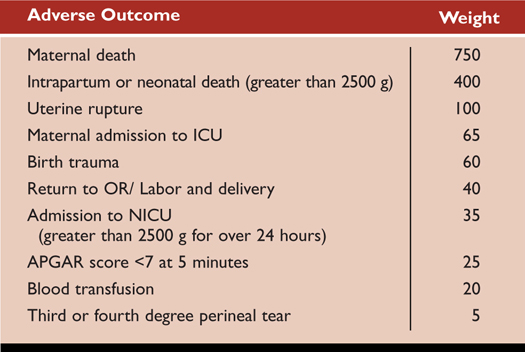
Table 1. Adverse Outcomes and Weights Associated with Each Adverse Outcome
The Adverse Outcome Index (AOI), defined as the percentage of deliveries with one or more of the adverse events, became the primary outcome measure. Secondary measures were the Weighted Adverse Outcome Score (WAOS), calculated as the sum of weighted adverse outcome scores divided by the number of deliveries, and the Severity Index (SI), calculated by summing the weighted outcome scores and dividing by the number of deliveries with a complication (Mann et al., 2006). Creators of the AOI recognized that while the AOI was a significant step forward in obstetrical quality metrics, additional study of the tool was needed. A combination of professional society support and notable publications promoting this tool were likely responsible for its relatively rapid adoption by many organizations today.
With the passage of time, we have much more sophisticated data sources available to us today through clinical information systems in obstetrics. The availability of large data sets with detailed information about the nature of care received as well as perinatal outcomes prompts us to revisit this index. Our review has identified four limitations with the AOI and its derivatives. Understanding these limitations will lead to better usage and perhaps assist in its refinement.
Limitations
To illustrate these points, we have constructed a simple AOI score with 3 of the more common components from the AOI definitions, namely a third- or fourth-degree perineal laceration, a 5-minute Apgar score of 6 or less, and use of maternal transfusion. AOI scores were defined as the percentage of patients with any one or more of these factors. Scores were constructed using de-identified data extracted from the electronic medical record used in a four- hospital system with more than 7000 births annually in the Baltimore-Washington corridor. The analysis period was between January 2005 and April 2010. The results are shown in Figure 1.
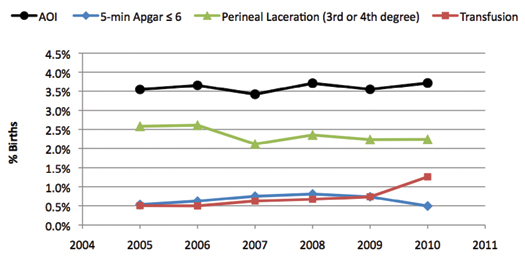
Figure 1. Trends in the AOI and Each of Its Components
Limitation 1. Dominance by Common Components
It is a basic mathematical fact that a composite score will be most heavily influenced by its most prevalent components. Simply said, common factors will swamp uncommon ones. This is evident in Figure 1 where the trend of the AOI (black) is parallel and similar to its most common component—perineal laceration (green). The stable trend in the AOI masks an increasing trend in one of the less common components, transfusion rates. In our example, no matter what interventions might have been introduced a composite score would largely reflect the dominant effect of perineal laceration rates.
Limitation 2. Ambiguous Link between Intervention and Outcome
A composite outcome measure does not allow the reader to make a plausible link between a specific intervention and a specific and related outcome. As described above, the perineal laceration effect dominates, and it is hard to imagine how an intervention such as team training in communication would affect this specific parameter. Consequently, the relationship between a specific safety intervention and this AOI is ambiguous. In addition, unmeasured factors, apart from the safety initiative, also may be influencing the AOI. In our example, the rate of perineal laceration could have been reduced simply by increasing cesarean rates and thus diminishing the numbers of vaginal births and the potential for perineal laceration. Cesarean birth, use of instrumental vaginal techniques (forceps and vacuum) and episiotomy use are key procedures under the control of the clinicians and do have a plausible link to perineal laceration. Assessing the rates of these interventions is essential for understanding why and at what cost perineal laceration rates are decreasing. Figure 2 highlights these rates in our data and reveals clearly that falling perineal laceration rates were associated with falling use of instrumental vaginal delivery methods and episiotomy and not related to primary cesarean rates that were stable.
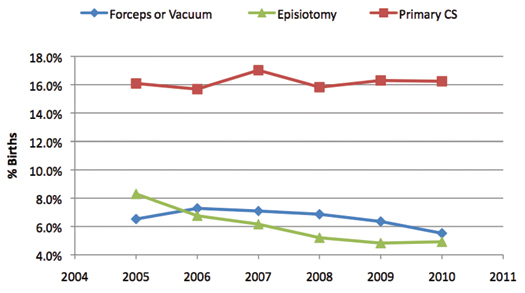
Figure 2. Trends in Intervention Rates
Rates of episiotomy and instrumental vaginal birth have been decreasing nationwide for many years based on results from clinical trials and changing practice guidelines from professional societies (Oliphant et al., 2010; Frankman et al., 2009). It is impossible to distinguish the influence of these general tendencies from the influence of concomitant quality programs based on the AOI trend displayed in Figure 1.
Limitation 3. Changing Complexity of Patient Population
A composite outcome score does not provide information on the underlying health status of the patient population, which also affects outcome. Clinical outcomes are a function of both healthcare received and the basic health status of the patients. Figure 3 shows trends in three common perinatal risk factors in our study population. All risk factors showed increasing trends, which would be expected to affect outcomes negatively. Thus in our example the stable AOI underestimated performance because it did not account for the rising complexity levels in the mothers.
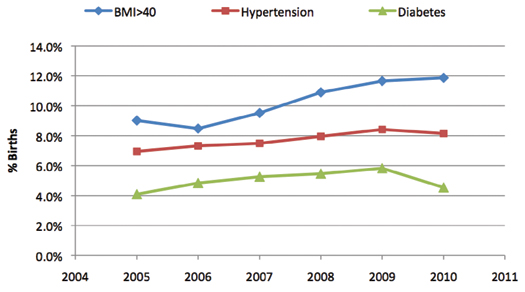
Figure 3. Trends in Maternal Conditions
Limitation 4. Paradoxical “Adverse” Outcomes
Maternal transfusion rates exemplify this problem. Walker et al. (2010) reviewed 342 medical records with an adverse outcome in order to assess the accuracy and clinical relevance of all 10 standard AOI components. Transfusion rates were particularly problematic as a measure of poor quality because in 39% of the cases reviewed, the transfusion was necessitated by a pre-existing condition such as placenta previa, abruption or preeclampsia-associated hemolysis. In these situations, failure to transfuse would have been a significant quality of care issue yet the act of transfusion was counted as an adverse outcome. The paradox arises because transfusion contributes to the AOI, which is intended to reflect poor care, but indicated transfusion is a marker of good care.
This paradoxical effect is propagated and amplified in the SI where the impact of transfusion is weighted 20 fold.
In summary, a composite AOI is tempting in obstetrics because adverse outcomes are rare and combining several uncommon events creates a number with an incidence that is amenable to statistical analysis without requiring huge data sets. However, the limitations are considerable: trends in a single factors can mask important and contrary trends in less common factors. Additionally, one cannot see the targeted effect of specific interventions or gauge the influence of other changes in the population under study. Finally, including outcomes such as transfusion rates confuses the issue as they do not consistently indicate a quality of care problem. Adding a number of internal multipliers (weights) further obfuscates the interpretation of its derivative the SI.
Alternative Approaches
Complex problems usually require complex solutions than can seem unattainable. Often the first step in solving complex problems is to break them into simpler parts. Perinatal outcomes and quality of care are separate, albeit related, issues. Furthermore perinatal outcomes depend, in part upon the quality of care and the complexity level of the case mix. Thus there are at least three distinct elements that are interrelated—complexity of patient population, the quality of care received, and ultimately the perinatal outcomes. We suggest that a more informative picture is provided when measurements of each of these elements are provided to the reader.
Table 2 demonstrates this approach in a well designed study that is easy to interpret. Clark et al. (2010) examined a single problem—elective delivery prior to 39 weeks—and the effectiveness of three different policies. Each of the three policy groups began with equal complexity as measured by their baseline rates of elective delivery before 39 weeks. Measures of quality of care were presented along with outcome measures. The chosen outcome was plausibly linked to the care intervention. The study sample was large enough to examine differences with statistical confidence. Together this data presents a clear and compelling case for Policy A, because one can see improving rates in the quality-of-care marker (elective delivery under 39 weeks) as well as improving rates of the related adverse outcome marker (intensive care admissions) with no other ill effects (increase in stillbirth rates).
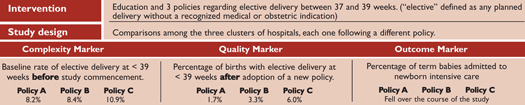
Table 2. Different Approaches to Lower Elective Delivery Before 39 Weeks
(click here to view a larger version in a separate browser window)
The checklist in Table 3 summarizes concepts to consider when planning a study using composite scores to measure the effects associated with a quality of care intervention, which implies answering the three basic questions: Did clinicians do what they were supposed to do? Did it make a difference? Is there a plausible link between the two?
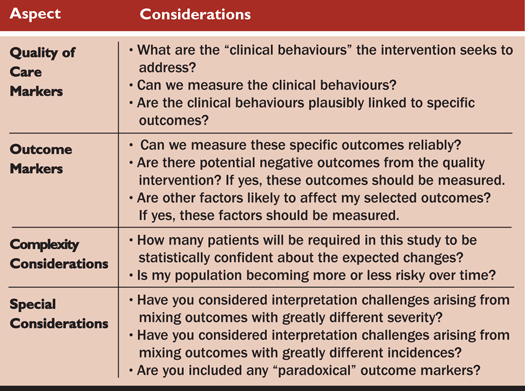
Table 3. Designing Composite Scores to Assess the Impact of Quality of Care Interventions
A second alternative approach is the application of risk adjustment methodologies to obstetrical process and outcome measurement. As yet, no uniform methodology for risk adjustment exists for obstetrics, although efforts to tackle this for maternal morbidity and cesarean rates are emerging (Srinivas, Fager & Lorch, 2010; Srinivas, Epstein, et al., 2010). We agree with the creators of the AOI that application of risk adjustment methodologies and standardized definitions are necessary in order to fairly compare results across organizations (Mann et al., 2006).
Measuring quality of care is inherently complicated, as it implies answering many questions such as “Was the right intervention performed, at the right time, and for the right reason? Did it make a difference? Was it cost effective? To date, most direct quality program assessments involve chart reviews in a sample of medical records. We applaud the human effort to accomplish this—particularly if required repeatedly in order to examine long-term trends.
Systematic examination of electronic medical records is another approach to obtaining this information in a comprehensive and unbiased way. Even with computerization, this process is demanding and requires careful definition of the quality indicators and validation that the computerized extraction is an accurate representation of the care given. Once this methodology is validated, automated periodic analyses are easy and greatly reduce the human effort.
Medical history is replete with examples of technological advances that have caused quantum leaps in our understanding of disease. Examples include radiological techniques to view inside the body, biochemistry to detect aberrant internal processes, and genetic markers to predict who will become ill. The widespread adoption of electronic medical records provides that kind of advance as well as a data platform from which to examine the healthcare delivery processes. We are early in the journey of discovery regarding what makes for safer patient care; we are, however, beginning to have tools that can help us dissect and analyze these problems directly and provide insights that help us continue to build models to evaluate “next generation” tools for measuring the quality of perinatal care.
Emily Hamilton is an experienced obstetrician gynecologist and the senior vice president, clinical research, at PeriGen. Her research focuses on complications found during the labor and delivery period.
Samuel Smith is chairman of the department of obstetrics and gynaecology at Franklin Square Hospital in Baltimore, Maryland, where he been recognized as a leader in many successful initiatives to improve the quality of obstetrical and gynecological care.
Dorothy Berry is a distinguished fellow of the American Society of Healthcare Risk Management, and a certified professional in healthcare risk management and in Six Sigma. She applies both her nursing and professional risk management expertise in her role as senior vice president, patient safety, risk management and clinical services at PeriGen.
Omer Ben-Yoseph has extensive experience in biomedical informatics and has been a key member of the design and development of PeriGen’s PeriBirth software as well as transforming the collected clinical data to measure and track quality performance.
Dan O’Keeffe is PeriGen’s chief medical officer. Drawing upon his broad clinical and administrative experience, Dr. O’Keeffe also serves as the executive vice president of the Society for Maternal Fetal Medicine.
Eric Knox is the chief patient safety officer at PeriGen. He was a founding board member of the National Patient Safety Foundation, and currently consults and advises leaders in healthcare organizations throughout the United States on perinatal issues.
PeriGen is a technology-enabled professional services company specializing in risk reduction and clinical quality improvement in Obstetrics. PeriGen is a US corporation headquartered in Princeton, New Jersey, with offices in Canada and Israel. For more information, please visit www.perigen.com.
References