Outperform the Competition: Hospital Value-Based Purchasing
July / August 2012
![]()
Outperform the Competition: Hospital Value-Based Purchasing
 Competition to capture the highest incentive payments from the Medicare Hospital Value-Based Purchasing (VBP) Program is going to be very tight. “Even if you are above the 90th percentile, you could still have a very poor score and leave money on the table,” said Tami Lewis in a recent Modern Healthcare article (McKinney, 2012). As director of service excellence at Robinson Memorial Hospital in Ravenna, Ohio, she is among many hospital quality administrators who are looking at competition where several tenths of a point can represent a forfeit of hundreds of thousands of dollars in federal reimbursements. But there’s a way to gain an edge. All other factors being equal, effective use of information technology (IT) is likely to determine which hospitals perform best in the VBP Program over the upcoming years.
Going for the Gold
For FY 2013, the contest is, in fact, over. How well hospitals performed from July 1, 2011, to March 31, 2012, will impact their Medicare reimbursements next fiscal year. For discharges on or after October 1, 2012, CMS will withhold 1% of base Diagnosis Related Group (DRG) Medicare payments and simultaneously give hospitals the opportunity to gain some, all, or more of it back with value-based incentive payments. The VBP final rule estimates the total amount to be withheld and available for incentive payments in FY 2013 to be $850 million for about 4,000 acute care hospitals paid under the Medicare Inpatient Prospective Payment System [IPPS]. Each participating hospital will receive an estimate of its value-based incentive payment at least 60 days before October 1, 2012; notification of the official payment for each FY 2013 discharge arrives on November 1 (Federal Register, May 6, 2011).
Exactly how much a particular hospital gains back depends upon its performance scores. Along with other reforms to emerge from the Affordable Care Act, the Hospital VBP Program aims to improve care and reduce costs by changing how Medicare pays for services. Instead of passively doling out payments for volume as under the current fee-for-service model, Medicare will actively “purchase” care by linking a portion of DRG payments to overall hospital performance on a set of quality measures for inpatient acute care. In this way, the VBP program makes hospitals accountable to some degree for both the quality and cost of services delivered to patients, and reduces their opportunity to profit from medical complications and errors.
Studies indicate that one in seven Medicare patients experiences an adverse event while in the hospital, and one in three Medicare beneficiaries experiences hospital readmission within a month of discharge (OIG, 2010). Under the current system, if a patient develops a preventable complication (such as an infection) during hospitalization, a hospital could be eligible to receive a higher DRG payment along with payments for follow-up care along. In 2009, Medicare spent an estimated $4.4 billion in additional care for patients harmed in the hospital, and $26 billion in readmission costs (OIG, 2010).
The Ground Rules – Demonstrating Sustained Improvement
Scoring hospitals on both achievement and improvement, CMS has hospitals competing with their own historical track record as well as with each other. A hospital earns improvement points based on its performance in the CMS Inpatient Quality Reporting Program (IQR) during the designated baseline period (July 1, 2009, through March 31, 2010) and achievement points based on how it compares to all hospitals during the performance period. Performance scores are pitted against benchmarks and thresholds to derive achievement and improvement scores (Figure 1, page 20). For FY 2013, the VBP program includes 2 domains: clinical process of care, covering 12 measures; and patient experience of care, covering one measure (derived from 9 dimensions). CMS aggregates the scores and weights the two domains, 70% for process and 30% for patient experience, to arrive at a total performance score (TPS) that is used to determine incentive payments. The hospital’s TPS score will be posted on CMS Hospital Compare, along with its IQR scores, making transparency another inducement to perform well in the VBP program.
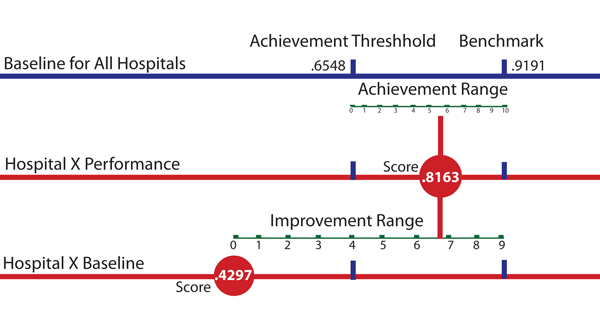
Figure 1. Measure AMI-7a Fibrinolytic Therapy
Hospital X is awarded 7 points for improvement and 6 points for achievement. The improvement score will therefore be used to calculate Hospital X’s TPS.
As with any contest, some VBP participants will come out way ahead, and others will not fare well. Hospitals in the top 50th percentile should realize a net increase in payments, while those in the lower half should anticipate a net decrease. CMS expects that incentive payments will range from 0.0236% of the amount withheld for the lowest-scoring hospital, to 1.817% for the highest-scoring hospital. Over the next 5 years, hospitals will increasingly feel the financial impact of their scores as CMS incrementally raises the stakes. The percent to be withheld and available for incentive payments will increase by .25% each year until it hits 2% in FY 2017, representing an estimated total of $2 billion. In FY 2013, the average VBP revenue risk has been estimated at $888,812 and the median risk at $250,415 per hospital; spanning 5 years, estimates are at $6.67 million and $1.88 million, respectively (Davis, 2010).
The top-performing hospitals in FY 2013 are likely to have higher achievement relative to improvement scores since achievement trumps improvement in the VBP program. While CMS uses the higher of the two scores to the arrive at the TPS, the maximum number of points a hospital can receive on any given measure for improvement is 9, compared to 10 for achievement. Furthermore, if a hospital exceeds the performance benchmark, it receives the highest score of 10, and the improvement score is subsequently irrelevant. But most hospitals should expect to see their improvement scores used to calculate the TPS. Unlike the AMI example above [Figure 1], the other clinical process benchmarks and thresholds are very high, above 99% and 90% respectively, making it difficult to consistently perform well in achievement. CMS requires a minimum of only 10 cases for each clinical process measure. Therefore, failure to meet protocol in even a few cases can lower scores significantly, and subsequently lower the amount of the payment incentive.
In the long run, hospitals that demonstrate sustained improvement in the quality of patient care should come out as the high performers. Demonstrating sustained improvement with established process measures is not enough to succeed in the VBP program. When all hospitals do perform consistently well on a particular measure, CMS expects to retire it. This type of measure, referred to as “topped out,” underscores the competitive nature of the Hospital VBP Program. The big winners will be hospitals that are flexible, quick to adapt to changing practices and protocols. The VBP measures will evolve over time, making them somewhat of a moving target. For FY 2014, CMS will add a new clinical process-of-care measure, SCIP-Inf-9, which tracks postoperative urinary catheter removal.
More significantly, CMS plans to introduce new domains focused on results to further draw out and reward hospitals that are truly delivering high-quality care. CMS expects to add VBP measures for improved patient outcomes, prevention of hospital-acquired conditions, and efficiency (Federal Register, 2010; Blum 2011). In FY 2014, the VBP program will add the “outcome” domain, which includes three new measures to cover mortality rates for heart failure, acute myocardial infarction heart failure, and pneumonia patients. Results of a study by the Yale School of Public Health and other collaborators entitled “What Distinguishes Top-Performing Hospitals in Acute Myocardial Infarction Mortality Rates?” supports the approach of CMS. The study found that complying with evidence-based practices and protocols alone was not a key differentiator for achieving low mortality rates among the hospitals (Curry et al., 2011). Instead, the top performing hospitals were distinguished by an infrastructure that fully reinforces the delivery of high-quality care. Such infrastructures include the involvement of senior management to provide quality data and adequate resources; engaged physician leaders, empowered nursing staff, and involved pharmacies; strong communication and coordination; and the use of root-cause analysis to develop strategies for improvement (Curry et al., 2010).
Jeffrey Robbins is CEO of LiveData, and has served as its technology visionary since the company’s founding in 1991. After LiveData’s early successes in manufacturing data acquisition and delivery, he extended the company’s technology to other industries by supporting a broad range of industry protocols and offering an open architecture solution for real-time data integration. He propelled LiveData into the healthcare market, winning two U.S. Army SBIR (Small Business Innovation Research) awards and joining CIMIT, the Center for the Integration of Medicine and Innovative Technology, where LiveData has led data integration for the Operating Room of the Future.
Robbins has served as co-chairman of the Medical Device Plug and Play (MD PnP) Communication Standards Working Group of the CIMIT Operating Room of the Future. He was also a member of the U.S. Advisory Board to the ISO & International Electrotechnical Commission, and Senior Technical Advisor to the National Rural Electric Cooperative Association. He may be contacted at jeffr@LiveData.com.
References
Blum, J. (2011, November 10). Improving quality, lowering costs: The role of health care delivery system. Statement before Senate Committee on Homeland Health, Education, Labor and Pensions. Available at http://www.hhs.gov/asl/testify/2011/11/t20111110a.html
Curry, L. A., Spatz, E., Cherlin, E., Thompson, J. W., Berg, D., Ting, H. H., Decker, C., et al. (2011, March 15). What distinguishes top-performing hospitals in acute myocardial infarction mortality rates? Annals of Internal Medicine, 154(6), 384-390.
Davis, C. (2010, June 30). Medicare value-based purchasing: 75 percent of hospitals face losses. Fierce Health Finance. FierceHealthFinance. Available at http://www.fiercehealthfinance.com/story/medicare-value-based-purchasing-75-percent-hospitals-face-losses/2010-06-30
Federal Register, 76(88). 42 CFR Parts 422 and 480. (2011, May 6). U. S. Dept. of Health and Human Services, Centers for Medicare and Medicaid Services. Medicare Program: Hospital Inpatient Value-Based Purchasing Program. Available at http://www.gpo.gov/fdsys/pkg/FR-2011-05-06/pdf/2011-10568.pdf
McKinney, M. (2012, March 3). Sneak preview. Modern Healthcare.
Office of the Inspector General (OIG), U. S. Dept. of Health and Human Services, (2010 November). Adverse events in hospitals: National incidence among Medicare beneficiaries. Available at http://oig.hhs.gov/oei/reports/oei-06-09-00090.pdf
Additional Reading
Part II of this article, How Innovative Technology Helps Capture the Highest Incentive Payments, is available at http://psqh.com/white-papers.html#outperform.