Integrated Quality Measures Improve Patient Safety & Care
November/December 2010
Integrated Quality Measures Improve Patient Safety & Care
Using a data warehouse, Piedmont Clinic integrates information across hospitals and independent physician practices for clinical integration, population health and quality improvement and reporting.
The Piedmont Clinic is a physician hospital organization (PHO) headquartered in Atlanta, Georgia. The PHO is comprised of 4 hospitals and 671 physicians. Two hundred and fifty of these physicians are employees of Piedmont Healthcare, while the remaining non-employed physicians are located in independent practices across the Atlanta metropolitan area.
In 2008, the Piedmont Clinic welcomed a new CEO who has led the clinic leadership in its development and adoption of a clinical integration model that blends clinical and financial integration. As part of this process much discussion revolved around the best way to track and use data to create integration. After reviewing approaches by other systems, a decision was made to construct a data warehouse to facilitate clinical integration.
In 2009, Recombinant Data Corp was selected to partner with Piedmont in building the Clinical Integration Trust (CIT). Recombinant works with healthcare systems to overcome the challenge of disparate data sources that are distributed among many locations including physician practices, hospitals, healthcare payers and IT vendor systems. Recombinant integrates these data sources into a clinical data warehouse that can be utilized for a wide range of initiatives such as clinical integration, population health, and quality improvement and reporting.
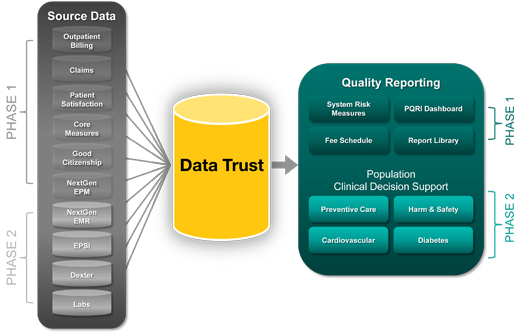
Phase I – Establishing Clinical Integration Infrastructure
In January 2010, the Clinical Integration Trust (CIT) was launched. Physician members of the Piedmont Clinic were given access to dashboard and reporting tools designed to measure and monitor their progress toward the following goals:
- Patient satisfaction as measured by Press Ganey for office visits.
- Core measures: quality measures for inpatient hospital care.
- PQRI performance: quality measures for professional care from a wide range of physician specialties.
- Population health: measures physician compliance with data submission necessary to gather population health information across the clinic.
- Improving efficiency and cost.
Why PQRI??
The Piedmont Clinic searched for a measure set that would be more appropriate to clinically integrating the specialties within their PHO. CMS’s Physician Quality Reporting Initiative (PQRI) met the criteria for a national standard that was representative of office-based family medicine as well as a wide array of specialty care.
PQRI was designed for community physicians who see Medicare patients. They record a special quality code (CPT II) on their bills to indicate that a particular action was taken such as checking HbA1c or blood pressure levels. Numerator and denominator criteria are clearly defined, and based on the diagnostic, procedural, and quality codes recorded on each bill.?
The range of PQRI measures is designed to represent many specialties. The Piedmont Clinic’s Quality Committee worked with representatives from each clinical specialty to identify three PQRI metrics for each specialty. Each MD in that specialty was trained on how to evaluate patients and include CPT II codes on the claims to reflect the various quality interventions specified for a particular PQRI measure (e.g. mammography). This information was then reflected in that MD’s “dashboard” (available via a secure web portal) and refreshed each time the practice sent billing information. The billing information included all patients regardless of payer. Physicians have greater confidence in the reported results because these codes are entered by their own practice. They are able to validate results down to the patient and/or visit level when questions arise. That gives physicians the ability to make specific changes in their practice: examples include correcting coding practices within their office or enhancing the quality and/or consistency of clinical care to ensure the PQRI measures are met.
The program was initiated with onsite practice consultations, signing of Business Associate Agreements (BAAs), training on PQRI coding practices, and implementation of data capture solutions over a 6-month period prior to launch.
Data Capture
The Piedmont Clinic had selected outpatient billing data as a key data source for clinical integration and quality improvement metrics. A number of challenges had to be overcome to ensure that data could support timely, accurate measure calculation. Comparable reported measures across the many practices would be essential to support meaningful clinical integration.
Technical challenges stemmed from the wide variety of billing solutions employed by Clinic members. Employed physicians utilize a common EMR and practice management solution. However, the non-employed physicians had independently devised their individual approaches to managing and submitting bills. The result was approximately 150 unique combinations of practice management software, operating systems, clearinghouses, submission processes, and billing file formats. The project team encountered antiquated billing systems, DOS, and even paper-based practices without any computers. One practice had turned on their PC in the late 80s… and not upgraded since.
Recombinant developed a suite of data capture software, which was installed on each practice’s system. The software detects newly created billing files, encrypts them into a highly secure format, and sends the encrypted file to the secure data warehouse environment. The software can handle nearly the full range of technical complexity existing at the physician practices. A web entry form was also developed to address low-tech practices with paper-based processes.
Once the securely encrypted files are received at the data warehouse, they must be interpreted and translated into one common file format for efficient processing. Recombinant developed a suite of parsing solutions, which translate standard file formats (NSF, EDI) as well as the extensive customization found across the Piedmont practices.
The technical challenge of data capture had been overcome, but the maintenance challenge had begun. The status of these installed data capture solutions required administrative monitoring functions to detect both inactive software and lapses in file submission. Alerts were also implemented to help the Piedmont team provide timely response and resolution.
In addition to technical issues, political obstacles were blocking the healthcare system from leveraging the information contained in this data. It was necessary to remove these obstacles prior to implementing any technical solution. Piedmont needed a data capture solution that not only functioned properly, but addressed the physicians’ key concerns:
- The local practice’s IT budget would not be impacted.
- The practice would not be required to perform technical tasks to submit data files to the CIT. The solution had to function without any additional actions required by the practice.
- Patient data would be handled securely and in accordance with HIPAA regulations.
- Practice data would only be accessible for the specified purposes.
- Bills for practice physicians not belonging to the Piedmont Clinic would be deleted prior to data warehouse processing and measure reporting.??
The Piedmont team visited each practice individually to provide consultation and reassurance that concerns were appropriately addressed. Costs associated with implementation of the data capture solution were covered by the Piedmont clinic. The solution itself was designed to be secure and in compliance with HIPAA regulations. Governance policies and processes were implemented to ensure that data requests are appropriately reviewed and approved. The Piedmont team was able to successfully resolve physician concerns and implement an appropriate data capture solution for each practice.
Obtaining Patient Satisfaction Survey Results
Obtaining patient satisfaction survey results from the vendor’s website presented another data capture challenge. The vendor did not offer automated data feeds as an option. Manual extracts based on website queries were required each and every time a data update was needed. Piedmont’s goal was to refresh the CIT at least weekly with current survey results.
In order to overcome this barrier, Recombinant devised “robot” software that simulates steps a user would take to gather patient survey results from the website on a weekly basis. The software automatically and securely performs the functions that previously necessitated a tedious manual process to obtain and integrate survey results.
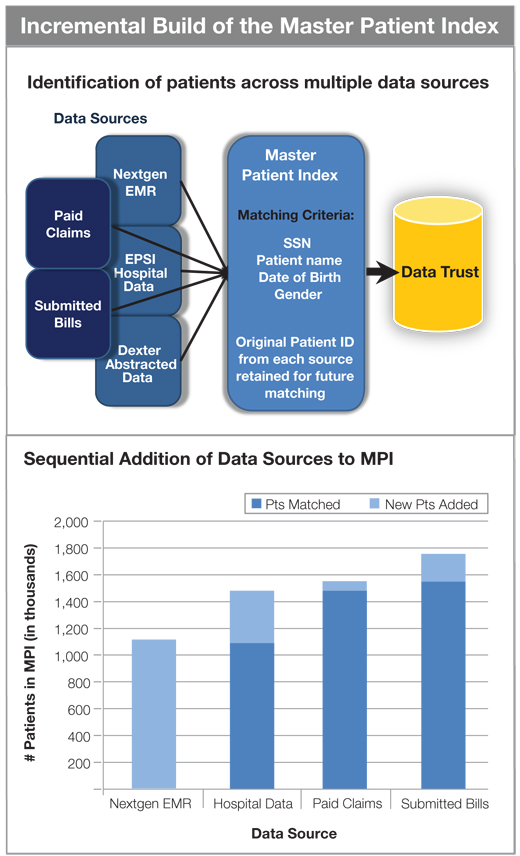
Figure 2 – The master patient index was initially populated with patients from the employed physician’s EMR. Hospital data, paid claims from insurers, and submitted bills from practices were sequentially matched to this base of identified patients. The MPI continues to grow as new patients interact with the Piedmont system.
Integrating Disparate Data Sources
Incorporating multiple data sources into one data warehouse to support quality reporting is a typical challenge faced by PHOs. In addition to the submitted bills necessary to support PQRI, additional data sources were required to support the system risk scorecard and other reported information. Individual physicians had to be identified across all data sources in order to summarize and report their performance results accurately. Physician identifiers and names were used to bring the relevant information together to create meaningful dashboard results.
Improvements to Performance Reporting
Information that had never been available became readily accessible. Instead of waiting several months for individual and organizational performance reports, physicians had direct access to daily updates of this data. They had visibility into the drivers behind results and could independently validate data and take corrective action. The availability of this feedback mechanism produced real improvements within months of CIT implementation.
The information provided through the CIT is helpful to both management and individual physicians. Previous performance reports had given limited information to management, but had not met physicians’ needs. In the new solution, organizational performance is summarized in the system risk scorecard. PQRI measures on the dashboard can be filtered by practice, specialty, or individual physician. Physicians can drill down into the individual records used to calculate their measure score to validate accuracy and identify opportunities for improvement. Supporting details are available, including the specific patients, claims, and codes used to determine numerator and denominator values. CMS official measure definitions and code definitions are easily referenced.
Clinical Integration Promoted Efficiency
Targeting topics of interest to the physicians was critical to program engagement. Physicians and practice managers were particularly pleased when tedious manual processes were replaced. Prime examples were improvements to patient satisfaction survey processes and fee schedule accessibility.
Patient satisfaction surveys are now conducted in a far more efficient manner. Previously the practice managers had to manually compile lists of patients who were eligible for patient satisfaction surveys. Now the CIT automatically identifies eligible patients along with their names and addresses. The list is securely sent to the survey vendor, resulting in improved physician satisfaction and a streamlined patient satisfaction survey process.
Practice managers can now access negotiated fee schedules for each insurer to ensure an accurate understanding of patient co-pay and deductibles. They can determine whether the insurer’s payment matches the negotiated rate for services. Previously the practice manager either had to call the insurance company or request a report from Piedmont support staff. Negotiated fee schedules for six insurers are now available to them online 24/7.
Phase II — Fresh Visibility into Population Health
In order to effectively manage a patient population, healthcare systems must have the ability to identify the target patient population and pertinent clinical information. Typically, each patient’s clinical information is dispersed across multiple care providers. Each provider has access to information gathered during their own patient interactions, but typically has no view into other physician’s or hospital medical records. Fragmented information creates gaps in knowledge, which can translate to sub-optimal clinical care.
The Piedmont Clinic’s Phase II goal was to leverage the advantages of the Clinical Integration Trust (CIT) for population health management. Their challenge was to integrate management of preventive care and selected chronic disease populations across physician practices, hospitals, and other providers within the network.
New insights into population health became possible with the integration of additional data sources and expansion of CIT dashboards. Inpatient admissions, outpatient hospital care, and EMR data for employed physicians were added to the existing Data Trust. Patient experiences across the PHO could be understood and leveraged toward meaningful actions. Information could be shared between all physicians caring for a patient.
Identifying Patients across Multiple Data Sources
Identification of the same patient across multiple data sources was accomplished with a master patient index (MPI). The MPI works by matching common pieces of identifying patient information between the data source being added and the existing patients within the CIT. An index of patients already in the CIT is maintained, and patient-matching logic is processed whenever a new data file is added.
This allows any given patient’s information to be brought together from disparate data sources. Lab results, vital statistics, recent procedures, inpatient admissions, medications, office visits, and other information can now be used in combination to gain better visibility into a patient’s history and current medical care.
Patient Assignment to Providers
The Piedmont Clinic encourages physicians to be aware of all care rendered to their patients and to ensure that appropriate care for prevention and chronic conditions are delivered. Through the CIT each physician has access to information about patients assigned to them. Patients are assigned to all physicians whom they have seen multiple times in the past 2 years. This definition is a proxy for identifying physicians with whom the patient has an established relationship. Physicians can now determine whether their assigned patients have received appropriate preventive care regardless of who provided that care. For example, a cardiologist can now view information pertaining to the patient’s diabetes in addition to cardiovascular information.
Population Health Dashboard
Piedmont decided to begin the population health initiative by focusing efforts in a few areas: cardiovascular care, diabetes, preventive care, and harm & safety. A short list of well-accepted measures based on national standards was chosen in order to reduce debate. Historical trends, performance targets, and organizational performance are displayed for each measure.
Cardiovascular Care, Diabetes, and Preventive Care Registries
A mix of ambulatory and inpatient measures were selected to provide a broader picture of care across the PHO. Long-term outcomes for diabetics (AHRQ PQI) are reported in addition to shorter term outcomes and process measures. AHRQ’s defined measure set for prevention quality indicators (PQI) is designed to address quality of care for conditions sensitive to preventative care.
Disease populations for cardiovascular care and diabetes are identified. Physicians viewing the dashboard see measures reported for their assigned patients within these populations. All information about their assigned patients is available regardless of who actually provided the care.
Physicians can drill down further from the cardiovascular care, diabetes or preventive care dashboards to view their assigned patient list. For each patient, information has been assembled from multiple sources to provide relevant lab results, medications, vital statistics, procedures, visits, etc. The physician can interact with this information to compare results from different sources, view historical trends, and identify patients in need of clinical interventions or due for routine tests.
Harm & Safety
Preventive care and Patient Safety Indicators for inpatients (AHRQ PSI) measures were applied to the full patient population. AHRQ has a defined measure set for patient safety indicators (PSI), which is designed to identify potential adverse events occurring during hospitalization. AHRQ’s measure set is a national standard. Measure definitions and a free software tool for measure calculation are available on the AHRQ website at http://www.qualityindicators.ahrq.gov/psi_overview.htm.
These Patient Safety Indicators are reported for four individual hospitals and for the organization. Charts of historical trends are available for every measure as well as event lists to support further analysis. Surgical site infections are similarly reported within the Safety dashboard. This provides each physician a list of their patients affected by AHRQ Patient Safety Indicators and/or certain hospital acquired infections while in the hospital.
Patient Safety Indicators had previously been calculated by support staff. While the AHRQ tool was used, several tedious manual steps were still necessary. Automation of the measure calculation process together with routine data updates resulted in process efficiency improvements, which were greatly appreciated by the Piedmont staff.
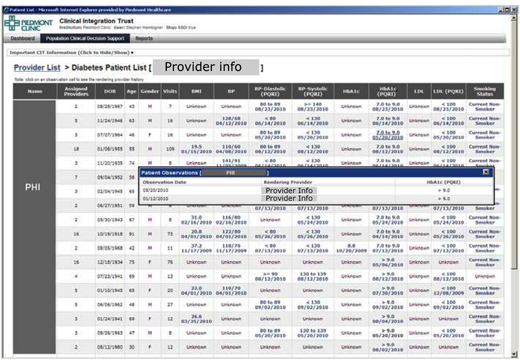
Figure 3 – Physicians can drill into their assigned patient list for preventive care and for selected chronic conditions. Patient lists enable the physician to explore the patient’s most recent clinical information and historical results from multiple data sources regardless of which physician actually delivered the care. Patients due or overdue for tests or preventive services can be identified and appropriate clinical interventions scheduled.
Results
A majority of the Piedmont Clinic’s previous quality reporting had focused on inpatient care. While these purely hospital-based initiatives had delivered significant improvements over time, the impact was limited to the relatively small inpatient population. There was roughly a 10% improvement over time, which impacted about 100 patients each year.
By contrast, within 9 months the CIT program has improved overall performance by 11%. These measures affected a much larger population, resulting in better care for thousands of patients.
Focusing population health and clinical integration efforts on ambulatory care resulted in a much larger impact within a relatively short time frame. The measures are of much greater relevance and interest to the physicians. This combination of increased impact and physician engagement show promising signs of continual improvement for the foreseeable future.
Next Steps
Next steps for the Piedmont Clinic include tackling the challenge of a risk adjustment model. Risk adjustment alleviates concerns regarding comparative patient severity levels. Piedmont is experimenting with Hierarchical Condition Categories (HCC) from CMS. Cost predictions for the coming year based on this risk adjusted approach will be compared with actual results to fine-tune their preliminary model.
Efficiency measures for outpatient hospital imaging services are under development. Cost per utilization measures are being defined as well. These are based on CMS metrics and methodology. Each of these will be delivered in a new dashboard page within the CIT.
Key Success Factors
Governance
The Piedmont Clinic’s Quality Committee is comprised of physicians interested in driving quality and performance. They represent both procedural and cognitive specialties. These are “early adopters” willing to experiment with new tools and to act as change agents to encourage physician engagement. CIT metrics, protocols, performance targets, and remediation strategies for improving performance are governed by this group. They helped to define a change management process, which will be critical to maintaining high levels of physician engagement.
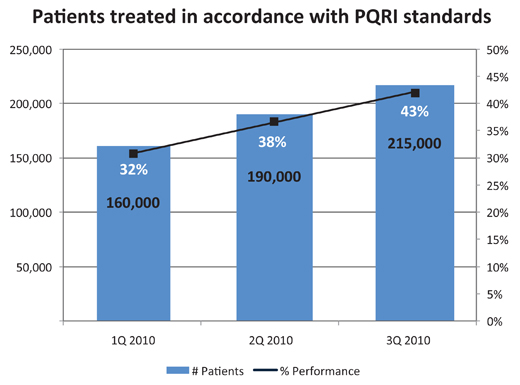
Figure 4 – Within nine months, composite PQRI performance improved by 11%. An 11% improvement translates to 55,000 more people provided care meeting PQRI performance standards. This overall composite score reports PQRI performance across measures selected for each specialty. Only the top three measures required for each specialist are included in the composite. The overall composite score is weighted by volume of patients in each measure to reflect the greater opportunity for performance of high volume measures.
Tools for Improvement
A key success factor was to provide the physicians with the tools necessary to support improvement processes. The CIT provided tools not available otherwise, such as the dashboard, patient drill downs, and timely performance measurement with targets and benchmark comparisons.
- Provide the ability for physicians to validate data themselves.
- Make it easy to see performance in comparison to targets and obtain actionable feedback.
- Make it easy to identify opportunities for improvement.
Lessons Learned?
Establish peer protection. Hospitals have robust peer processes. No such ambulatory peer protection was available, and physicians were reluctant to expose their data to scrutiny without it. The Piedmont Clinic found a way to create this legal protection by becoming certified as a Patient Safety Organization (PSO). PSOs provide both privilege and confidentiality, enabling healthcare organizations to report and analyze data on adverse events in order to improve quality. Becoming a PSO has allowed the Piedmont Clinic to view performance across practices and hospitals in order to improve quality and manage harm and safety issues.
Technology is essential but not sufficient. With the implementation of the CIT, physicians experienced a shift from managing individual patients to managing a population. While the practices had been given tools to view their performance status and patient information, related business processes needed to be created to ensure that appropriate actions were taken. The Piedmont Clinic has implemented new business processes and assigned care coordinators to provide support including identification and contact of patients needing clinical interventions.
Directly address physicians concerns about data security. Initially, some physicians were reluctant to provide their practice (claims) data to the PHO because they were concerned about the use of the data by the PHO. Concerns about competition and potential misuse of practice data must be addressed before meaningful progress can be made. The Piedmont Clinic overcame this obstacle by implementing specific governance processes that regulate data access and use.
Actively pursue and measure physician engagement. Newly implemented tools and processes will be imperfect. Physician engagement was critical to creating an accurate, meaningful, user-friendly system. The Piedmont Clinic actively engaged physicians in providing feedback and creating a process for managing change. They allowed the physicians to kick the tires while the system was new and were willing to make adjustments based on their input.
Knowing who was engaged and who was resistant enabled the Piedmont team to discover and resolve issues. They learned that physician engagement was easier when it was measured. Compliance measures for reliable data submission and website access are incorporated into the system risk dashboard. A list of non-compliant physicians is available through the dashboard.
|
IHI NATIONAL FORUM POSTER |
Dan Housman is a co-founder and managing director at Recombinant Data Corp., a company delivering healthcare providers and academic medical centers data warehousing and clinical intelligence solutions. Housman has more than 15 years of experience in entrepreneurship, product management, and software development.
Betsy Parker is a senior project manager at Recombinant Data Corp., and is responsible for the Clinical Integration Trust (CIT) project at Piedmont Healthcare. Prior to joining Recombinant, Parker held senior project management positions at Blue Cross Blue Shield, Integrated HealthCare Information Solutions, Perot Systems, Tufts Health Plan, and First Health Group. Parker may be contacted at bparker@recomdata.com.