Improving Reliability with Root Cause Analysis
September/October 2013
Improving Reliability with Root Cause Analysis
Root cause analysis (RCA) has an image problem. Because various regulatory agencies require RCA to be used under specific circumstances, usually following an adverse event, the tool is primarily viewed as reactive. When these “sentinel events” occur, we pull out the microscope—RCA—and take a deeper look. Used in this way, RCA is often viewed as a “money-taker” because it appears only to consume people’s time and resources when they already feel overloaded. Rarely do we ask for a return on investment (ROI) associated with an RCA.
|
Charles J. Latino* was a chemical engineer who joined Allied Chemical (today more commonly known as Honeywell) in 1951. He eventually rose to become the head of maintenance and engineering at Allied’s large chemical processing facility in Hopewell, Virginia. He always had a fascination with aviation reliability and wondered why his manufacturing operations could not perform as reliably. In 1972 Charles established the first corporate reliability engineering R&D department in the manufacturing sector to further explore the application of his reliability principles. In 1985 Charles retired from Allied Chemical and purchased his group to form Reliability Center, Inc. Charles is the father of Robert J. Latino. *father of article’s author, Robert Latino |
We hear more and more about high reliability organizations and their mindfulness for the future. Root cause analysis can help organizations become more mindful and prepare for the future. Why do we have to wait for bad things to happen to apply RCA? What would the results be if we applied RCA in a more versatile manner on unacceptable risks, near misses, or chronic failures that do not rise to the severity of a sentinel event? Used in this way, RCA promotes reliability, provides measurable ROI, and improves patient safety.
The History and Applicability of High Reliability Organizations
In healthcare today, the term high reliability organizations (HROs) has become mainstream. Much of that can be attributed to the book Managing the Unexpected (2007). In the opening pages, co-authors Weick and Sutcliffe state their basic message:
This book is about organizations, expectation, and mindfulness. Our basic message is that expectations can get you into trouble unless you create a mindful infrastructure that continually does all of the following:
1. Tracks small failures
2. Resists oversimplification
3. Remains sensitive to operations
4. Maintains capabilities for resilience
5. Takes advantage of shifting locations of expertise
These powerful concepts are not new to many industries outside of healthcare. They were the foundation of reliability engineering as applied to the aviation and nuclear industries as early as the 1950s.
In 1972, Allied Chemical Corporation pioneered the practical transition of reliability principles from aviation to heavy continuous-process manufacturing. Allied formed the first research and development (R&D) group to explore, design, and implement a corporate reliability engineering department, which served Allied’s 300 facilities around the world (Latino, 1981). At Allied, the keys to reliability were defined as:
1. Priority
2. Proaction
3. Focus
In the mid-1990s these reliability principles began to be integrated into healthcare through The Joint Commission’s (TJC) requirement that hospitals use failure modes and effects analysis (FMEA) and root cause analysis. Rick Croteau, currently patient safety advisor at Joint Commission International, was a systems engineer with the U.S. space program in the 1960s before becoming a surgeon. He understood from his work in systems engineering that “people make mistakes, and that is not a cause of failure but rather a condition of function that must be incorporated into the design of systems” (Croteau, 2010). As a result of his efforts, in 1996 The Joint Commission issued A Framework for Root Cause Analysis in Response to a Sentinel Event. This was the beginning of the formal transition of reliability principles into the healthcare sector. In that transition, we understand that all organizations are systems. All systems have inputs, a transformation of these inputs in some form or fashion, and outputs. Given this, these enduring reliability principles, as defined by Allied Chemical, can apply anywhere and are completely transferable.
|
Root Cause Analysis: A process for establishing logically complete, evidence-based, tightly coupled chains of factors, starting from the least acceptable consequences—an event—to discover the deepest significant underlying causes of that event.* Definition of Terms Logically complete: We ask the question “how could” something occur versus asking simply “why” did it occur. Evidence based: Hearsay does not fly as fact. Tightly Coupled Chains of Factors: This is the difference between “cause and effect” and “categorical” RCA. cause-and-effect RCA makes a direct connection between the event and what caused it to occur. The first step in categorical RCA is to choose a category—e.g., methods, management, materials—and then brainstorm possible causes within that category. Categorical RCA often displays possible categories in “fishbone” diagrams. The logic is not directly correlated to cause and effect of what happened; rather, it may simply be brainstorming in a category. If we choose the wrong categories, we may miss important contributing factors. Least Acceptable Consequences: This is how we define our EVENT. This means some threshold of pain has been crossed, and now someone has decided to do an RCA. What is that threshold of pain (e.g. sentinel event, high-risk near miss, etc.)? Deepest Significant Underlying Causes: You can take an RCA back to Adam and Eve if you want, so where to stop is a prudent question. Our rule of thumb is to drill down into the latent or systemic root causes to the point where the solution is obvious (e.g. flawed policy, procedure, incentive plan, training mechanism, purchasing habits, etc.) |
Priority
Priority is not a hard concept to understand, but it is very difficult to make a reality. We define priority as:
Management has decided to support achieving reliability behaviors by properly allocating funding and backing it up with appropriate policies and procedures (Latino, 1985).
This requires a cultural shift from leadership that recognizes preventative action or “proaction” as being more desirable than reaction.
Leadership cannot just talk about reliability; leaders’ actions have to demonstrate a serious effort—including financial support—to implement the required infrastructure to support proactive behaviors. Everyone in the organization, from the C-suite to workers at the “sharp end,” needs education to understand these principles and how they affect decision-making processes. Leaders will also demonstrate sincerity by establishing a reliability policy with related procedures for proper application and associated system infrastructure to ensure success. This makes reliability a requirement for the organization instead of just a talking point that has no negative consequence if the proactive behaviors are not demonstrated.
Leaders are often perceived of by the rank and file as never having the time and budget to do things right but always having the time and budget to do things again. Making reliability a priority is a reversal of that paradigm.
Proaction
In a nutshell, Reliability = Proaction = No Surprises!
We define proaction as:
Any activity that will improve 1) operations, 2) prevent equipment, process or human failure or 3) lessen the consequence of failure (Latino, 1985).
Currently, the RCA task carries a negative connotation within facilities that are required by regulation to perform such activities under certain circumstances. A certain threshold of pain—for example, a sentinel event, according to The Joint Commission—must be incurred before the RCA requirement goes into effect and actions are taken. The Joint Commission states, “Such events are called “sentinel” because they signal the need for immediate investigation and response” (2010). The regulatory requirements themselves encourage a reactive paradigm. So this raises the question, “How much authority do we want our regulators to have in making us ‘do the right thing’?”
Do we want or need a regulatory body to make us more proactive, or do we want to be proactive because it is the right thing to do? Industries manufacture widgets. In healthcare, the product is the quality of our lives. If there is anywhere in our society where proaction should be expected, it is in healthcare, where lives are at stake every day. Proaction occurs when we apply RCA to events that pose unacceptable risks and have not yet caused harm.
Focus
We define focus to be:
The directing of human energy and capability to the significant few issues and opportunities that result in quantum benefits.
What are some possible opportunities to apply proaction? Such events might include:
1. Unacceptable risks as defined by FMEA results.
2. Chronic failures that occur so frequently they become viewed as a cost of doing business.
3. Near misses, where we “got lucky” and stopped an error chain before anyone suffered pain, and no RCA was required.
Given these principles of reliability as a framework for root cause analysis, we need a process for selecting, quantifying, and prioritizing candidates for proactive RCA.
Failure Modes and Effects Analysis
Failure modes and effects analysis is currently required by TJC (LD.04.04.05, Element of Performance 10): “At least every 18 months, the hospital selects one high-risk process and conducts a proactive risk assessment.”
Failure modes and effects analysis (FMEA) involves looking at the steps in a process flow diagram and looking for ways in which failures could occur that would interrupt the quality and continuity of the overall process flow (Figure 1, page 34).
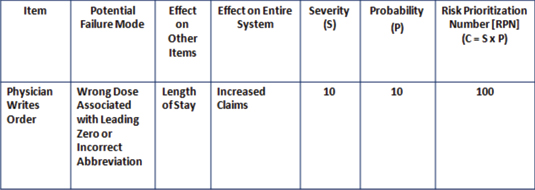
Figure 1: Sample Failure Modes and Effects Analysis (FMEA) Worksheet
Across most industries that use FMEA, the accepted standard for measuring risk is the following equation:
Severity (S) x Probability (P) = Criticality (or Risk Prioritization Number [RPN])
When a new process or plan is being developed, an FMEA will seek to identify the vulnerabilities in a process or plan and allow us to design out the flaws before the plan is put into action. This is a truly proactive tool because it is assessing risk and identifying the significant few opportunities for harm. The significant few are the 20% or less of the potential failure modes accountable for 80% or greater of the potential risks (Figure 2, page 34).
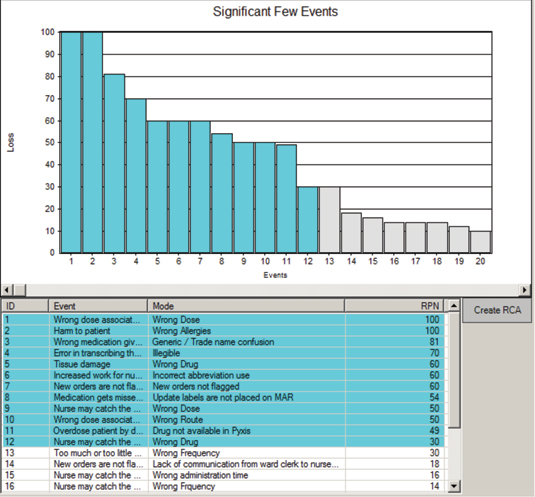
Figure 2: Sample Significant Few Results from an Opportunity Analysis on IV Antibiotic Omissions
Courtesy of the Reliability Center, Inc.
With this information in hand, we can apply our effective RCA approach to understand why the risks are so high. When latent or systemic causes are identified and corrective actions properly implemented, our risks will be mitigated to an acceptable level (after all, no system is failsafe!).
Opportunity Analysis
While opportunity analysis (OA) is not required by any regulatory agency, it is the most effective tool for identifying qualified candidates for RCA and associating an ROI for each one. The primary difference between FMEA and OA is that OA seeks to identify failures that are occurring in a given system over a year’s time, and FMEA identifies failures that might occur.
The OA measure of loss is:
Frequency/Yr x Impact/Occurrence = Total Annual Loss
In this approach, the following steps take place:
1. Map out a process flow diagram of the process chosen to analyze.
2. Define what a “failure” is for that process.
3. Define “assumptions” for the costs associated with each failure (i.e. labor, lengths of stay, supplies, etc.).
4. Obtain input (i.e. failure modes and frequencies) to fill in the blanks on the OA spreadsheet, from those closest to the work in the process chosen.
5. Calculate the significant few.
6. Conduct RCA on the significant few.
This OA approach makes a financial business case for why we should be conducting RCA on events that have not passed through the regulatory threshold of pain. These chronic failures and near misses, if left unchecked, pose additional risks in the future for contributing to sentinel events.
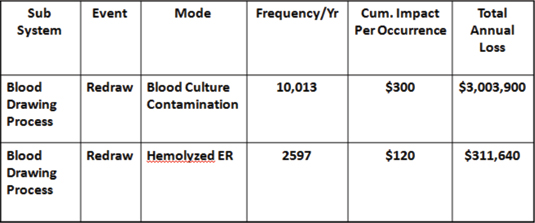
Figure 3: Sample Opportunity Analysis (OA) Worksheet
For example, in a 225-bed, acute-care facility, an OA was conducted on the blood drawing process. This study was commissioned by the chief financial officer (CFO) to find cost reduction opportunities. When the OA was completed, it was found that the average cost of a redraw was about $300, and the total number of redraws per year was 10,013. This demonstrated a loss of more than $3 million per year that was hidden in plain sight (Latino, 2009). It was accepted as a cost of doing business and therefore never questioned. It was not harming anyone, so there was no regulatory requirement to do it. Was it the right thing to do? Ask that CFO.
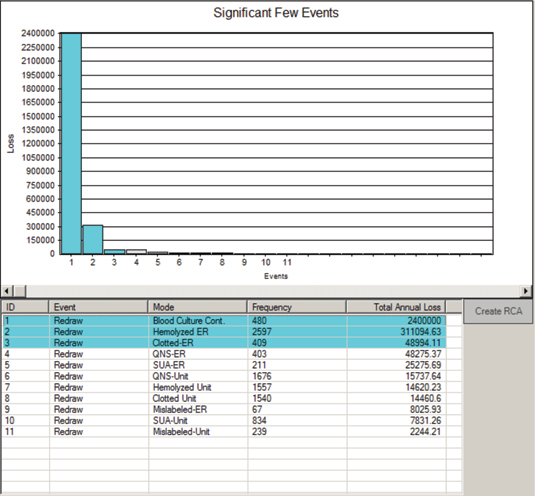
Figure 4: Sample Significant Few Results from OA on Blood Redraws
Courtesy of the Reliability Center, Inc.
Conclusions
These concepts, approaches, and tools can be applied in any organization, anywhere once some type of performance gap has been identified (e.g., compliance, frequency of occurrence, costs, patient satisfaction indexes, readmissions, Six Sigma projects, claims, falls, etc.). A performance gap is simply the difference between a desired state and a current state.
RCA needs a facelift simply because most organizations and executives do not understand its true versatility and capability in practical application. Since we are only required to apply it under duress, it has negative connotations. However, if we approach true RCA with our minds open to its proactive capabilities, we will create an environment where personnel will not run from RCA meetings (or stress out about attending them) but embrace their proactive nature. We’ll get better at preventing consequences instead of getting better at responding to them.
Bob Latino is CEO of Reliability Center, Inc. (www.reliability.com), a consulting firm specializing in improving equipment, process, and human reliability. Latino may be contacted at blatino@reliability.com.
References