Critical Values Reporting: Making Day-to-Day Performance Count
January/February 2011
Critical Values Reporting: Making Day-to-Day Performance Count
Figure 1. The immediate impact. The design of the color-coded database drastically improved critical value reporting.
In 2006, the Shepherd Center, a 132-bed spinal cord and brain injury rehabilitation hospital in Atlanta, Georgia, was having trouble meeting The Joint Commission’s (TJC) requirements for reporting critical values: measuring, assessing, and, if appropriate, taking action to improve the timeliness of reporting, as well as the timeliness of receipt by the responsible licensed caregiver of critical tests, results, and values. Failing to meet these expectations could very likely result in delay of treatment for acute medical conditions or possibly hasten a patient’s death.
We determined that the workflow for reporting critical values at Shepherd was chaotic and inconsistent among caregivers. Hence, demonstrating reliable performance in communicating critical values to the appropriate caregivers in a timely fashion was an ongoing problem. Early in 2006, under the direction of several creative clinicians and our information systems personnel, a critical-values reporting database was designed in Lotus Notes, our organization’s online communications software. This homegrown tool captured results and tracked the timeliness of several metrics with the intent of eliminating manual documentation. It was from this baseline performance that further improvements began.
Partial results in 2007 clearly demonstrated an unreliable process, leaving the communication loop incomplete. Multiple attempts to address improvement resulted in a less than desirable process completion rate between 52 and 72%, which did not meet TJC’s requirements.
To transform our organization’s ability to attain a higher level of patient safety, we needed to develop organizational structures that would involve frontline staff members and require their ownership and accountability of clinical processes. We designed structures to encourage this behavior, but it wasn’t until we adopted the concept of “mindful behaviors” that we became confident we could sustain improvement. Mindful behaviors, or “mindfulness,” is a concept we learned from the work of E. Scott Geller, PhD, called People-Based Patient Safety® (www.peoplebasedpatientsafety.com). Mindful behaviors ensure levels of alertness and performance that indicate delivery of safe care is a priority. This approach also requires embedding evidence-based practice into day-to-day operations, which supports our organizational philosophy of “doing the right thing first.”
Work Groups to Promote Mindfulness
In 2008, we developed a strategy to ensure patient safety as a practical application to providing care. We designed an organizational structure we called Work Groups (WG) to promote mindful behaviors. Each of the nine Work Groups has different objectives depending on the area of specialty practice, although the commonality among all is the responsibility to:
Demonstrate that safe and reliable patient care and services exist throughout the organization and to define credible measures to evaluate the level of effectiveness utilizing The Joint Commission (TJC), Centers for Medicare & Medicaid Services (CMS), and the National Patient Safety Goals guidelines that are based on scientific, evidence-based practice.
Work Group membership was designed to be multidisciplinary, with senior leaders selecting clinicians who were pursing growth through one of our organization’s professional career ladders to serve as members. Each Work Group selects a leader from among its members, and these roles align with natural stakeholders. For example, our infection preventionist leads our Infection Control Work Group. Work Group leaders consistently seek opportunities to increase their knowledge base pertaining to current practice and continually work to keep abreast of any changes in regulatory requirements. Work Group leaders are responsible for using human resources efficiently to promote mindful behaviors in their areas of practice through:
- concurrent data collection to serve as a catalyst promoting evidenced-based clinical practice one on one;
- analysis of the data and prioritization of opportunities for improvement throughout the organization;
- dissemination of all findings to promote awareness and stimulate change; and
- follow-up measurement to determine the effect a change has had on the practice.
The nine work groups are known as Medication Safety WG, Fall Prevention and Restraint WG, Critical Values WG, Rapid Response and Resuscitation WG, Wound Prevention WG, Infection Prevention WG, Environmental Safety WG, Patient Rights and Responsibility WG, and General Documentation WG.
One of the work groups that significantly impacted the ability to deliver highly reliable safe care was the Critical Values Work Group, which included the radiology manager, laboratory manager, respiratory therapy manager, one staff nurse, and two charge nurses. The chief nurse executive (CNE), the patient safety coordinator, and the director of quality/outcomes/patient safety served as team coaches. Physician champions from various departments served as ad hoc members when appropriate.
This Work Group’s first task was to clarify the current state for five key diagnostic areas, including the:
- process for communicating values for both inpatient and outpatient populations;
- definitions of the department-specific critical test values and results; and
- documentation of all critical test values and results.
Work Group members were trained to interpret the variation between actual performance and expected performance.
After identifying opportunities for improvement, the Work Group produced the initial formalized process map for the critical-value process.
The Work Group selected the following actions and prioritized the roll out:
- Revise data collection tool clearly articulating Measures of Success requirements.
- Design data summary reports with analysis and action plans containing monthly and quarterly results.
- Create a schedule for reporting to specific committees.
- Develop education for charge nurses and other key stakeholders, such as the laboratory, radiology, and respiratory departments.
CYCLE 1
Plan
The director of quality and patient safety coordinator served as facilitators and led the initial planning cycle. The organization understood that this was how things would get done until there was some evidence of success, and it was seen as a value-added process for team members.
The goal for process and documentation completion was set at 90% or greater. This was selected as a formal range that TJC defined for the practice although the organization aspires to 100% compliance.
Do
The practice changes were implemented, and staff education was provided by members of the Work Group who were most familiar with each discipline. The change began in the laboratory, with the respiratory, radiology, nursing, and pharmacy departments following thereafter.
Study
Aggregated data for calendar year 2008 continued to reveal a negative trend for completion of elements in the database. Toward the end of the year, there was a noticeable increase in the volume of actual critical-value results. At this point, the Work Group acknowledged that the practice of communicating critical values was still highly unreliable. The members voiced considerable concern that, although we had not experienced an event that had caused harm, patients were exposed to unnecessary risk. With every instance of non-compliance, the potential for patient harm escalated.
The human dynamic so familiar to process improvement is to move past placing blame on the individual. This Work Group was no different. We often noted that the organization has a high volume of professionals who are extremely competent and dedicated to the organization, so we asked, “How could we have poor results?”
With further analysis, we identified a new challenge. Our organization was growing, which resulted in expanded services and a 20% increase in bed size over the previous 2 years. Compared with the volume of critical values/results in 2008, the volume of critical values in 2009 grew by 21.1%. This growth in services, bed size, and volume of critical-values reporting meant that we had to streamline the workflow.
Act
At about the same time, TJC published an amendment to Goal 2 (NPSG.02.01.01) requiring three Measures of Success, adding an additional element of performance.
- The individual receiving the information writes down the complete order or test result or enters it into a computer.
- The individual receiving the information reads back the complete order or test result.
- The individual who gave the order or test result confirms the information that was read back.
With these additional requirements we knew we had our work cut out for us.
The Work Group decided the time had come to raise the expectations of the entire organization and tackle the culture and practice related to critical values. The group conducted “live observations” to more clearly understand the obstacle to performing correctly.
Further actions included revalidating the policy on reporting and communicating critical values to ensure current content and clearly defining expected practice.
CYCLE 2
Plan
The Work Group developed a “secret shopper” approach to critical values reporting. The laboratory called the director of quality or the patient safety coordinator when a critical-value report was identified during early mornings and late afternoons. This allowed for direct observation of the end users (front-line staff) at the time of expected performance.
We searched for all policies at Shepherd that had any type of reference to critical values so we could focus on reducing them to one comprehensive policy.
Do
“Secret shopper” observations and a policy search were conducted throughout all clinical units.
Study
Drill down revealed the existence of multiple policies and procedures for multiple departments, potentially adding to some of the chaos. Front-line staff observations opened the floodgates and captured what was really occurring. It was obvious that when clinicians were called with a critical value, it was extremely difficult for them to access the database intended for documentation of pertinent information. The barrier to ease-of-access for clinicians led them to choose a workaround by either writing information on a scrap of paper, or if in a hurry, on their hands.
This at-risk behavior was observed in 95% of all observations across five different units, including intensive care.
Act
The organization chose to move to a single, comprehensive policy and procedure defining the process steps for following up critical values. Incorporated in the single policy were abnormal values specific to disciplines and defined by physicians as “critical-test results” and “critical-test values” for the laboratory, radiology, pharmacy, point-of-care testing, and EKG. Each department’s physician leader presented these values to the Medical Executive Committee for approval. Ultimately, one facility-wide Critical Test and Critical Result Notification Policy and Procedure was created and approved.
After this, the Work Group changed the operational steps of the process to make it easier to “do the right thing” and harder to “do the wrong thing.” The group embraced the “Factors of Redesign” as described by Donald A. Norman in The Design of Everyday Things (2002). We were confident that pursuing these factors with forcing mechanisms and visual simplicity would result in favorable results.
CYCLE 3
Plan
The redesign of the electronic critical value report database was completed with the assistance of the information systems (IS) department during a 10-week period. Process maps for each type of abnormal value (routine, stat, or critical test) were created with the input of Work Group members. Each reporting department (laboratory, respiratory, radiology, pharmacy, and nursing) was vital in defining the current process required to complete a critical-value report for inpatient and outpatient arenas.
The patient safety coordinator then developed an Excel spreadsheet that showed each field requiring completion based on the type of abnormal value, reporting department, and patient type.
IS designed the spreadsheet so that incomplete fields in each type of critical-value report remain highlighted in yellow until completed by the appropriate staff. Each type of report contained only necessary fields for completion based on predefined parameters. This allowed staff to quickly scan a report and immediately recognize the next step in the process. As appropriate staff (reporting department, unit secretary, RN, etc.) entered information into the indicated fields in the electronic critical-value report, the highlight was removed on fields to denote completion. Completed critical-value reports contain NO yellow highlighted fields, indicating all appropriate staff members have been contacted regarding the critical result and appropriate actions were taken in a timely fashion. The final field on the report was an auto-calculation of the time required to complete the process. This function allowed the organization to ensure adherence to the policy regarding notification times, according to the type of test (critical test or critical result).
Do
Staff education was required upon completion of the redesign of the electronic critical-value report. Education tools were customized for each group requiring instruction. Members of the Critical Value Work Group were assigned responsibility for training staff in their own departments (i.e., manager of respiratory services trained all respiratory staff) using the completed process maps. Nurse educators then attended a “train the trainer session” held by the director of quality/outcomes/patient safety, the patient safety coordinator (PSC), and CNE. This training allowed each individual to practice a case in a test format of the modified database. The director of quality and PSC provided additional training for nursing unit managers and charge nurses. Nurse educators were then given the task of training all staff nurses on the new process.
One set of “new players”—nursing unit secretaries—came to the table to ensure success. The director of quality and PSC scheduled group and one-on-one training for all unit secretaries. Laminated instructions were provided to all trainees along with an electronic copy for use at any time.
Additionally, to simplify data tracking, IS created two new reports in EIR11 (Crystal) to allow for accurate export of data. One report gave detail by individual electronic critical-value report for each required field, and the second report allowed for uncomplicated export of data to a file permitting data display and graphing. Sharing results with all involved staff, especially with this successful and necessary process, was quite motivating. Daily data was available to all unit managers and reporting departments. Nursing unit managers could confirm completion of all critical-test reports on their unit at the end of each shift. Reporting department managers could ensure all critical values were reported in the electronic database because the database is capable of sorting by date, department, and unit.
Study
At the conclusion of the first 9 months, from 2009 through 2010, and after incorporating the newly designed process and database, the measurable effect the changes have had on the process has been quite impressive. The data reflects high-reliability practice, a by-product of mindful behaviors, with identification of only two special-cause data-point events related to failure to document the physicians’ response to a critical value. Drill down revealed that the physicians in both instances were informed of the result and responded appropriately ensuring the patients were not negatively impacted, although the database was not updated. The Work Group is cautious with its praise, but is confident that the process is reliable.
Act
As is represented in Figure 1, the overall journey for improvement is unending. The success of this Work Group has become the catalyst for the members’ in all Work Groups, and the momentum toward ownership of improvement has become contagious at the front-line level! The level of commitment to to this overall journey to attain quality and transparency has been driven from the top, initiated by our CEO Gary Ulicny, Phd, and supported and nurtured by the Shepherd Quality Subcommittee of the Board.
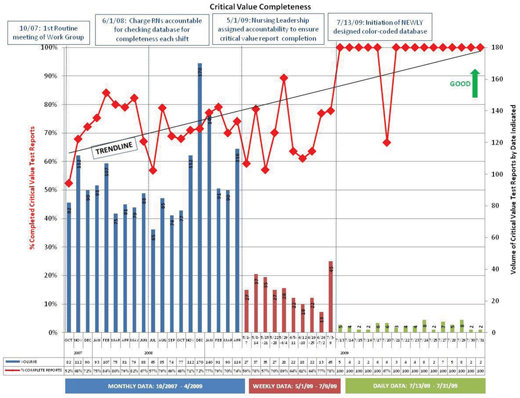
Figure 1. The immediate impact. The design of the color-coded database drastically improved critical value reporting.
(click here to view a larger version in a separate window)
Susan Bowen has been director of quality/outcomes/patient safety at the Shepherd Center in Atlanta, Georgia, since 2006. She may be contacted at Susan_Bowen@Shepherd.org.
Acknowledgment
Nancy Fendler was a patient safety coordinator at the Shepherd Center in Atlanta, Georgia, until February 2010, and was instrumental to this project and early versions of this manuscript.