Health IT & Quality – Bacchus and Healthcare
By Barry P. Chaiken, MD, FHIMSS
Showing great wisdom, our mothers cautioned us to never judge a book by its cover. Yet, when we purchase wine, we often look for the fancy label design, interesting back label story, or colorful capsule covering the cork. That said, most wine drinkers use price as the most important indicator of wine quality. Surely a $100 wine must be better than a $15 bottle, otherwise why would the retailer charge more for it?
In the absence of understandable, easily accessible quality metrics, we use price as a surrogate for quality. Sure, we may search reviews looking to see if the pretty label represents a 90+ point wine, but in the heat of the moment in a restaurant we read the wine list left to right choosing a wine by its price rather than its pedigree. Frankly, most consumers employ this this approach when they purchase products where quality and value are difficult to judge or trusted quality information is unavailable.
As we move to value-based reimbursement models where price matters, linking quality to price becomes more important than ever. The passage of the Affordable Care Act (ACA) dramatically changed the healthcare marketplace and the economics driving it. No longer could provider organizations indiscriminately raise prices to increase revenue and cover their costs. The ACA sets rules strongly encouraging provider organizations to take on risk and deliver measurable quality of care.
For example, hospitals no longer receive reimbursement for Medicare beneficiaries readmitted within 30 days for the same condition. Additionally, ACA incented the formation of Accountable Care Organizations (ACO), whether for Medicare/Medicaid or group health beneficiaries, which require these organizations to accept financial risk for patient care. Under this environment, both quality and cost matter like never before.
Cost and Quality Unlinked
To test the hypothesis that price does not reflect quality, Medicare cost and patient satisfaction data were analyzed to look for relationships between cost, number of procedures performed, and patient satisfaction (Nerdwallet, Inc.). The cohort of 427,207 patients represented those undergoing either knee or hip replacement surgery in 2012 at 2,750 reporting U.S. hospitals. Patient satisfaction was measured by whether the “patient would definitely recommend hospital” or not.
Although true clinical outcomes provide a medically more meaningful connection to care quality, all hospitals utilize patient satisfaction scores, such as patients recommending the hospital, in their quality assessment metrics. In lieu of using clinical outcomes that are more difficult to collect, the more standard patient satisfaction outcome noted above was used in this analysis.
Running simple correlation statistical analysis on this data set revealed the following:
- Correlation between patient satisfaction and annual number of procedures done = +0.345
- Correlation between patient satisfaction and average cost per case = -0.113
- Correlation between average cost per case and number of procedures done = -0.073
This analysis shows a pattern where the greater the number of procedures a hospital performs, the higher the level of patient satisfaction. In contrast, the cost of the procedure is not related and even a bit negatively related to patient satisfaction. The same result applies to the relationship between average cost per case and number of procedures done.
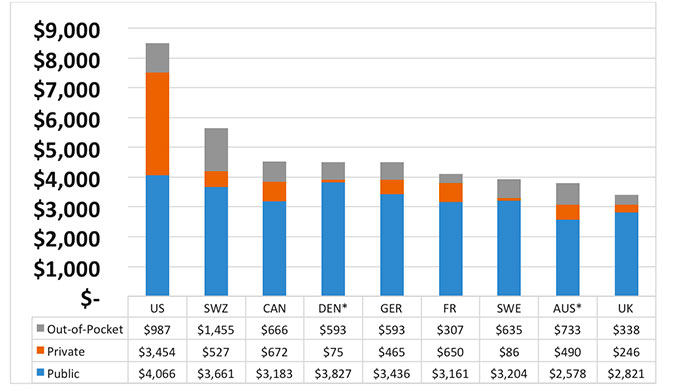
Figure 1 Per Capita Spending on Healthcare 2011
Country Comparisons
Looking at Organization for Economic Co-Development (OECD) data shows similar results. Among OECD countries, the U.S. spends the most per capita (Squires, 2014). Of the amount spent on healthcare, government spending per capita exceeds that of all other countries in the world. This number includes both residents with and without insurance of any kind. In contrast, these other countries provide healthcare to virtually 100% of their populations while we tolerate more than 10% uninsured. This surely will change with the roll out of the Affordable Care Act. Figure 1 shows a sampling of that data.
Although the U.S. spends the most per capita, we do not obtain proper value for all the resources devoted to healthcare. First and foremost, healthcare should prevent premature death. Yet, when the Commonwealth Fund analyzed this data in 2011, they found that the United States is worst at preventing death among citizens under 75 years of age. Of 16 OECD countries analyzed for the period 2006 to 2007, healthcare preventable deaths in the United States were the highest at 96 per 100,000 with France at 55, Italy at 60, Germany at 76, and the United Kingdom at 83 (Commonwealth Fund, 2011).
Time for a Change
The examples above clearly demonstrate that spending more does not lead to better clinical outcomes. Surely there exists a minimum level of expenditure, whether per capita or per procedure, that is necessary to achieve good outcomes, but the value linkage between cost and quality decreases significantly beyond a certain point. Guessing where that point is only recycles the trap where we believe that more expensive care must be better care. Only by measuring the actual cost of care and linking it to meaningful clinical outcomes can we be sure that we are obtaining value from our healthcare expenditures. Analytics provides a tool for us to use to understand what provides value and what is wasteful.
In addition, we must do a better job of coordinating care to eliminate duplicative and unnecessary tests, procedures, medications, admissions, and office visits. There is much to be done to improve our healthcare system. We have the tools. We just need to start intelligently applying them. Doing more is a dangerous and wasteful option that must be discarded. It is time to spend wisely.
Barry Chaiken is the chief medical information officer of Infor and a member of the Editorial Advisory Board for Patient Safety & Quality Healthcare. With more than 20 years of experience in medical research, epidemiology, clinical information technology, and patient safety, Chaiken is board certified in general preventive medicine and public health and is a Fellow, former Board member, and Chair of HIMSS. As founder of DocsNetwork, Ltd., he worked on quality improvement studies, health IT clinical transformation projects, and clinical investigations for the National Institutes of Health, UK National Health Service, and Boston University Medical School. He is currently adjunct professor at Boston University’s School of Management where he teaches informatics. Chaiken may be contacted at barry.chaiken@infor.com.
References
Centers for Medicare & Medicaid Services. Official hospital compare data. Retrieved from https://data.medicare.gov/data/hospital-compare/Patient%20Survey%20Results
Centers for Medicare & Medicaid Services. (2014, April 9). Medicare provider utilization and payment data:Inpatient. Retrieved May 5, 2014, from http://www.cms.gov/Research-Statistics-Data-and-Systems/Statistics-Trends-and-Reports/Medicare-Provider-Charge-Data/Inpatient.html
The Commonwealth Fund Commission on a High Performance Health System. (2011, October 18). Why not the best? Results from the national scorecard on U.S. health system performance, 2011. Retrieved from http://www.commonwealthfund.org/Publications/Fund-Reports/2011/Oct/Why-Not-the-Best-2011.aspx?page=all
Nerdwallet, Inc. Find the best hospital for… Retrieved May 5, 2014, from http://www.nerdwallet.com/health/hospitals/best/
Squires, D. (2014, January 17). Multinational comparisons of health systems data, 2013.
The Commonwealth Fund. Retrieved from
http://www.commonwealthfund.org/Publications/Chartbooks/2014/Multinational-Comparisons.aspx