Improving Interventional Lab Quality Measures with Real-Time Location Systems
By Leslie Mulshenock, MBA; and Matthew Paul Esham
Quality goals for diagnostic and interventional invasive laboratories can be difficult to measure effectively. In the lab, multiple factors can impact measurements and outcomes. Administrators typically focus on driving down costs while clinicians tend to concentrate on patient outcomes. Patients and their families, on the other hand, commonly pay attention to more subjective measures. For patients, quality metrics are driven not only by overall outcomes but also by personal experience and the level of caring they feel they’ve received from the moment they arrive at the registration desk to the time of their discharge (Schroeder, 2014).
Many potential levers impact quality, but it can be difficult to find an effective strategy that impacts multiple measures simultaneously. At the Center for Heart & Vascular Health—part of the Christiana Care Health System based in Wilmington, Delaware—the desire to enhance efficiency, improve staff satisfaction, and increase patient satisfaction has led to the utilization of a real-time location system (RTLS).
With cardiovascular diseases accounting for 17% of overall national health expenditures, it is clear that even a small impact on diagnostic and interventional lab productivity can have a substantial reward for a facility (Heidenreich et al., 2011). Furthermore, competition for at-risk cardiovascular patient populations drives a focus on the overall patient experience. Yet diagnostic and interventional labs face many productivity challenges that also have the potential to impact staff and patient satisfaction.
For each day’s caseload, lab clinicians must manage multiple patients and track a number of factors for each patient. Prep nurses work at different speeds, and prep time varies by case. Emergency cases present throughout the day. Every delay has a cumulative impact on the schedule, which can mean that patients wait longer than anticipated.
To ensure patients are ready and queued-up, clinicians must understand and respond to many factors, including:
- Anticipated procedure
- Complexity of the case
- Patient’s morbidity
- Medications the patient is taking
- Pre-procedure visit between provider and patient, if any
- Pre-arrival tests and treatments
- Status of required documentation
- Patient mix
From the first case of the day to the last, these dynamics impact services provided and it can be very difficult to isolate opportunities for process improvement without data.
Before Real-Time Tracking
Without a process to determine which factors were causing delays, creating inefficiencies, and driving down satisfaction, staff members at the Center were left to speculate on subjective evaluations. It was difficult to know where patients were located within the health system at any given time or to pinpoint where barriers existed. Staff members relied on intuition rather than data, and it was clear that a better way to track patients was sorely needed.
Organic growth at the facility had resulted in the creation of a home-grown spreadsheet tracking system that relied on manual data entry and was comprised of four screens representing waiting room, prep, lab, and recovery. As patients progressed through the path of care, staff members updated their status in a work list view by moving them from one screen to the next. However, staff could forget to update a patient’s status or inadvertently assign them to the wrong screen. Although brief notes could be documented, there was no way to see “roadblocks,” to understand the reason for delays or to observe status updates.
This tracking system also did not provide a real-time view of the scope of the daily schedule. Because the system was manual, staff members had to rely on numerous calls and pages to learn a patient’s status or spend time walking to units, looking for the specific nurse taking care of a patient. Not surprisingly, family members also had a limited amount of information.
As a result, the facility experienced reduced efficiency, decreased patient and family satisfaction, and an increase in frustration as staff members were forced to deal with an ever-evolving daily schedule driven by a lab coordinator in each of three functional lab areas: cardiac cath, electrophysiology, and vascular interventional radiology.
Functional Goals to Improve Quality
Our goal at the administrative level was to improve efficiency, which meant reducing workflow obstacles that prevented procedures from starting and finishing on time, managing the efficiency of lab turnaround time, and decreasing the amount of overtime caused by these delays.
At the patient level, our goals took the form of two specific concerns. The first was to improve communication with patients’ families who had expressed anxiety over sporadic updates. The second goal derived directly from patient feedback indicating that the number of calls required among staff left them feeling as if their care could have been better coordinated.
At the staff level, three distinct goals were identified as critical:
- develop a rapid and intelligent way to manage the daily schedule,
- reduce the number of pages and phone calls between care team members, and
- increase the overall visibility of patient flow through the environment.
Meeting these goals seemed to be a tall order with our homegrown tracking system. However, in 2013, Christiana Care Health System implemented real-time location system (RTLS) technology, which uses small, wireless tags attached to objects and people to automatically identify and track the location of patients, staff, and mobile medical equipment and their interactions as they move across the facility.
The tags communicate with sensors installed throughout the department, which transmit data to the RTLS software. The location of all tagged people and equipment is displayed on a real-time map. The software also uses a rules engine and sophisticated analytics to automatically draw conclusions about what is occurring in the care of the patient, what should happen next and who is responsible for making it happen. These care milestones and expected equipment flows are interpreted based on the interactions among patients, staff, and mobile medical equipment and support proactive communication to drive action.
Thanks to this intelligence, we are able to ensure that the appropriate staff and resources are available when and where they are needed, reducing or eliminating holdups that have a ripple effect in patient throughput and impact quality improvement goals
RTLS Sensor Selection
With several types of systems available, the RTLS solution chosen had to:
- Manage clinician workflow, patient state, and room state
- Intelligently relay information to users
- Mine and manage the data effectively
- Drive quality improvement goals
It was critical that the technology support the ability to resolve patient location down to bed and bay level while simultaneously minimizing false positives and false negatives. Infrared (IR) sensors as well as radio-frequency (RF) sensors were considered. Although both types of sensors operate through the communication of wireless tags and sensors, IR sensors use higher-frequency electromagnetic waves to communicate, but the signals can be blocked by walls, blankets, or clothing. Lower-frequency RF sensors, on the other hand, can transit through obstructions without sacrificing location accuracy. Some vendors offered RTLS technology that utilized both IR and RF sensors, but we wanted the ability to track assets and people on the same platform. That desire, combined with previous experience dealing with false negatives caused by accidental coverage of IR sensors, led the organization to select RF sensors.
The RF sensors also provided the added workflow advantage of “tag-to-tag” communication, which allows clinicians to mark pre-programmed care milestones by placing their RTLS tag within six inches of the patient’s tag and pressing a button. For example, anesthesia can mark the completion of their pre-operative assessment, or the pre-operative nurse can mark the completion of the patient’s preparation for the procedure. Finally, RF sensors offered the ability to improve communication with patients’ families—and therefore improve patient satisfaction.
Meeting Administrative Goals
Key metrics were identified to improve lab efficiency. The first operational goal was the ability to monitor and manage barriers to care and provide a streamlined workflow around case delays.
Today, when case delays are entered as roadblocks, an automated page is sent to the responsible physician, nurse practitioner, or physician’s assistant. The system has the added benefit of allowing staff, who are also wearing tags, to rapidly clear the entered roadblock once it is addressed by simply touching their tag to the patient tag, which automatically moves the case to the next phase of care. To meet HIPAA-compliance, however, the automatic messages don’t provide detailed information about the patient, e.g. “Patient Smith in bed three has a roadblock.” We are looking into putting the nurse’s callback number into the page so the doctor can speak directly to the patient’s caregiver.
A comparison of providers and the average number of minutes to remove a roadblock shows performance gains between the tagged and non-tagged staff. Tagged physicians clear roadblocks 19% faster than non-tagged physicians, while advanced practice nurses and physician assistants cleared their workflow obstacles 27% faster than their non-tagged counterparts. The pre-RTLS environment could not track roadblocks, so a baseline comparison of these numbers is not available. However, the post-implementation data between tagged and non-tagged providers shows a clear opportunity between the two cohorts of clinical staff. As a result, Christiana Care decided to pursue the use of wearable tags for all staff.
The second operational goal was to reduce delays in scheduled case starts, which have multiple negative impacts, including decreased patient satisfaction and potential increases in staff overtime. Prior to RTLS, the average patient arrival-to-case-start interval was 141 minutes in the cardiac cath lab and 102 minutes in the vascular interventional space. Six months after implementation, the average interval was reduced to 39 minutes for both areas (Table 1).
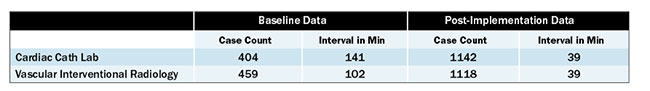
Table 1. Case delays before and after RTLS
The third administrative goal was to reduce the amount of time required to perform the daily scheduling and “air traffic control” required to keep patients smoothly moving through the labs. With time savings from the bird’s eye view afforded by RTLS, the organization has been able to drop the number of charge staff from three to one.
Meeting Patient Satisfaction Goals
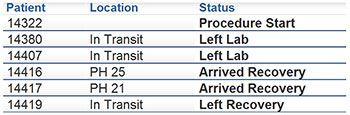
Thanks to a unique, anonymous RTLS ID number provided at check-in, patients’ families are now updated on their loved one’s status seamlessly. A summary view provides real-time procedural progress for family members to track, displayed on large computer monitors in the waiting areas (Figure1).
 |
|
|
Figure 1. Patient Waiting Room Display. The patient waiting room display allows family members to easily see the progression of the case. |
As a patient moves through the phases of care, the next responsible clinical party is notified via a status change on a dashboard, which also initiates a timer. This allows staff members to see, for example, which patients have been prepped and are ready to move to the procedure area. It also reduces the number of phone calls between care team members and promotes smooth patient flow through the department.
Prior to implementation of the RTLS, the Center noticed that its Press Ganey patient satisfaction scores were falling short of our goal of 95% satisfaction rating for overall care (Figure 2). Post-implementation, those scores have consistently exceeded the 95% target due largely to the use of RTLS, which helps minimize patient wait times and increase the visibility of patient status to families in the waiting room.
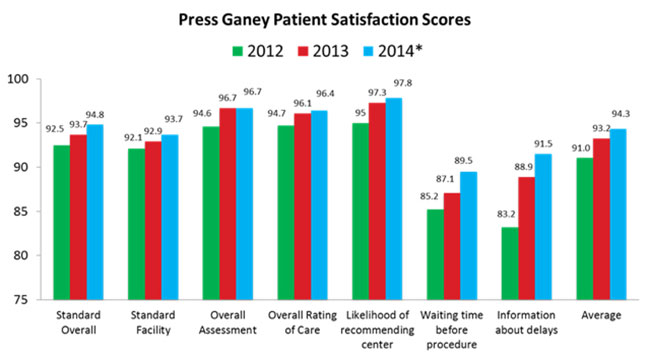
Figure 2. Press Ganey Patient Satisfaction Scores for Cardiac and Vascular Interventional Services. RTLS was implemented in January 2013. * partial
Meeting Staff Satisfaction Goals
RTLS provides the Center’s staff with a role-driven interface, along with the tools and feedback necessary to improve their daily workflows. Starting from the time a patient arrives or is scheduled for a procedure, RTLS guides the staff workflow. A key contributor to staff satisfaction with the system is the reduction in telephone calls and the ease with which patients and their status can be found.
Upon check-in, patients are provided a tag and checked into the system. The patient automatically appears on a dashboard in the prep-and-hold unit as “arrived and ready to be prepped.” An event timer then starts, so staff can see who has been waiting the longest, which allows prep-and-hold charge staff to quickly and easily reassign staff to minimize wait times.
When a nurse’s tag and patient’s tag dwell near each other for a configured time, the patient’s status automatically updates to “nurse saw.” After the prep is complete, nurses can use their tags to update the patient to “prepped” with another simple tag-to-tag interaction.
Throughout the patient workflow, staff members can quickly and easily see role-based work lists that show the patient status and how long they have been in that status. The ability to view both the patient status and room status, as well as the overall patient flow through the department, greatly enhances staff satisfaction as it increases efficiency.
Culture Changes
By tagging assets, patients, and staff members, Christiana Care’s Center for Heart & Vascular Health has gained data and insight that were previously unknown. At first, however, the staff was concerned that the tracking system would monitor their moves and be used against them. To quell those fears, the administration made it very clear that tagging would not be used as a performance management tool but rather as a process improvement tool. The goal was to improve patient care, patient satisfaction, and staff efficiency. As staff members began to see how RTLS technology achieved those goals, they no longer felt concerns over wearing tags.
Any facility moving to RTLS should educate its staff members prior to implementation, so they understand that the technology is a process management tool. Staff members need to know how RTLS can help them to do their jobs better and easier.
At Christiana Care, staff members gradually learned how automation could actually help them leave on time every day. In one case, tag history revealed that room turn-around time on a particular day was 40 minutes instead of the typical 30 minutes. That, in turn, caused employees to work overtime. Staff members were frustrated because they had to stay late. The manager asked them what had been different that day and what barriers had they experienced, which opened the door for dialog, leading to greater efficiency. As an added benefit, the Center has also gained greater control over factors that impact overtime costs.
Summary
RTLS provides the ability to positively impact quality metrics across a host of measurable goals, including resource efficiency, patient satisfaction, and staff satisfaction by providing real-time data and workflow status updates.
By leveraging the use of RTLS technology, we have experienced improved operations and patient flow in a hospital procedural setting. Communication has improved regarding patient status—among the members of the care team as well as with patients’ families.
As a result, patient satisfaction scores have risen, the staff is happier, and efficiency has improved. RTLS is even driving new projects; the Center is now in the middle of a care redesign project to shorten prep time. The addition of RTLS provides the Center with the ability to drive operational process improvements and patient care initiatives.
Leslie Mulshenock is the director of heart and vascular interventional services, and Matthew Paul Esham is the business relationship manager for the heart and vascular interventional services for Christiana Care Health System Center for Heart and Vascular Health in Wilmington, Delaware. Esham may be contacted at MaEsham@ChristianaCare.org.
REFERENCES
Heidenreich, P. A., Trogdon, J. G., Khavjou, O. A., Butler ,J., Dracup, K., Ezekowitz, M. D., et al. (2011). Forecasting the future of cardiovascular disease in the United States: A policy statement from the American Heart Association. Circulation, 123(8), 933-944.
Schroeder, S. (2014). Ensuring quality in the cardiac cath lab. Cath Lab Digest, (22)3, 1-32.