Healthcare-Associated Infection Reports
November/December 2013
![]()
Healthcare-Associated Infection Reports
How do states include and inform the public? Do people notice?
By John Govednik, MS; Maryanne McGuckin, Dr. ScED, FSHEA; Jessica Bunson, MS, MT (ASCP), CIC; David Hyman, MD, JD; and Bernard S. Black, JD

Healthcare-associated infections (HAIs) are one of the top-10 leading causes of death in the United States (Klevens et al., 2007). When in the hospital for treatment, a patient risks being among the 5% who become infected by bacteria or viruses from other patients or from the hospital environment (The World Health Organization, 2009). These bacteria and viruses are spread in various ways, including unwashed hands of personnel or visitors, inadequate sterile techniques, and patient care practices.
To reduce the chances of spreading HAIs, regulatory agencies such as The Joint Commission have recommended standards of practice for hospital accreditation, and Medicare has implemented financial incentives to reduce and eliminate HAIs as a patient health outcome.
These standards/incentives are part of a multimodal plan to improve healthcare quality. They improve job performance, as lack of healthcare worker (HCW) compliance with practice standards will jeopardize a hospital’s accreditation, and they support fiscal responsibility, as federal insurance programs no longer reimburse hospitals for HAI treatment costs. State-mandated public disclosure of infection rates introduces a new mode of accountability to address HAIs: consumer awareness and engagement.
This article summarizes a study funded by the Robert Wood Johnson Foundation’s Public Health Law Research Program (Black et al., 2011) in which we tried to determine: a) to what extent does the public, whom we refer to as consumers, know there are laws requiring public disclosure of hospital HAI rates, and b) do they use the state-mandated HAI public reports when faced with healthcare decisions?
We addressed these questions by reviewing state HAI report disclosure programs, assessing the perceptions of hospital infection professionals, and measuring consumer awareness and use of state HAI reports.
Background: What Are State HAI Reports?
By the end of 2013, consumers living in 32 states and the District of Columbia will have access to healthcare-associated infection rates in their state as required by state law. Thirty-one of those states provide information at the healthcare facility level; one state and D.C. provide statewide aggregate data without individual facility identification (Figure 1).
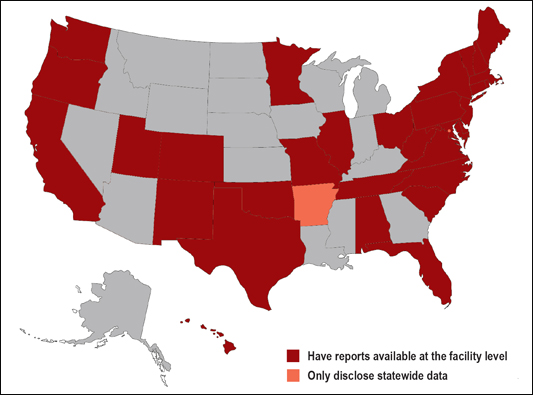
Figure 1. Map indicating states (plus D.C.) that have disclosed healthcare-associated infection information to the public as mandated by state law. Current as of December 2013.
In all of these states, HAI reports are hosted on websites affiliated with either that state’s health administration or hospital quality authority. Anyone intending to research this information can find their state’s report by searching [state name] healthcare associated infections, and following the link affiliated with the state health agency. In many of our search attempts, this method was successful in getting to the report. For many others, the state reports can be found under several layers of health agency links with headings like research, statistics, reports, or adverse events. Though not always easy to find, reports are all online and publicly available.
Reports can be a simple listing of all hospitals in a state and their infection rates. Some states present data only on their web pages, and others provide data on their web pages as well as on a downloadable PDF report. When listing a hospital’s HAI rate, many states, including Virginia, simply present the numeric data in list or table format. Many other states, including Vermont and Connecticut list the numeric data along with descriptors such as “better,” “no different,” or “within expected range” to describe what the numbers mean compared to the national.
States supplement their data reporting with graphics or symbols to indicate if the data represents good or poor performance. For example, reports for Oregon and West Virginia indicate each hospital’s infection rates as series of bar graphs, each with a “threshold” line indicating if an infection rate is high or low based on whether or not the bar graph has crossed the threshold. (Oregon uses benchmarks as their threshold; West Virginia uses a Standardized Infection Ratio [SIR]).
Colorado’s report uses a system of shaded circles to indicate better or poor HAI rates for each hospital, depending if the shaded circle is shown as filled or empty. Florida, Minnesota, and Texas use star-rating schemes in their reports, where low or high infection rates are shown by the number of stars next to the hospital’s name.
Color is sometimes incorporated into the reports. For example, New Hampshire and Tennessee combine numbers, symbols, and colors in their facility-specific data—if a state’s HAI bar graph crosses the threshold for a significantly high HAI rate, the bar is a different color to indicate the hospital’s HAI rate is normal, high, or low. Alabama’s report lists hospitals and their HAI data along with the descriptors “better, similar, worse” to indicate how the hospital compares to the national average (similar to Vermont), but they added color to indicate better hospitals as green and worse hospitals as red, to aid their consumers.
Some states go beyond a read-only report, and offer an interactive web portal that allows users to customize hospital comparisons by geographic area and even specify results only for a specific surgical procedure or infection. Reports are generated by clicking on areas of a state map image, or they are generated from a user’s search terms. Washington and California have developed interactive maps that can be enlarged to show a detailed metro region, with various colored symbols at each hospital’s location on the map—symbols that indicate the hospital’s infection rates for various procedures performed at that facility. Click on the symbol and a pop-up window appears with the data, for those seeking greater detail. Symbol legends are provided for web users to decipher the maps and their meaning.
Many states report rates for a variety of infections; some only on one or two infection types, most often central-line associated bloodstream infections (CLABSI). In most states, a hospital is shown as better than average if its HAI rate is significantly below the state average (using a 95% confidence level), worse if its rate is significantly above the state average, and average otherwise. Most states use a one-year measurement period.
Though varied in their formats and data presentation, state HAI reports are a valuable resource for consumers faced with making a decision on where to receive healthcare. Whether researching an individual hospital or making a comparison among many, the reports provide consumers with the knowledge needed to avoid HAIs. When a hospital is chosen for treatment (or if insurance has narrowed down the options to only one or two facilities), a patient can ask about the HAI rate and what steps physicians and HCWs will take during the treatment process to lower the risk of spreading an HAI to that patient.
Report Design and Public Awareness
Given the diversity of reporting styles and information presented to consumers, our team wanted to know how each state determined its format to disclose the HAI information in their public reports and the extent to which consumers were involved in their design.
Typically, there is one professional charged with the state’s report disclosure process, which we call the “HAI Coordinator,” though their exact title may vary across states—epidemiologists, clinical analysts, etc. Our team invited HAI Coordinators from states that had reports available to the public at the time of our study to participate in a brief Internet questionnaire. One declined, and three did not respond, giving us 28 completed interviews. For the non-respondents, we were able to gather partial information from their online reports and reporting websites.
We asked HAI Coordinators what, or who, guided decisions on public HAI report content and design. Responses suggest that report content was influenced by three key elements: 1) adherence to the letter of the law, 2) advisory board/expert panel recommendations, and 3) consumer feedback.
Letter of the Law
Eighteen states have laws that specify the content of the report. However, each state’s law has a unique set of stipulations.
In some states, the law identifies which infection types (surgical site, blood stream, etc.) are reported and disclosed, but leave the decisions of how they are presented up to the professionals who design the reports. In other states, the law not only specifies which infections to report, but also specifies the details of which data must be presented in comparisons (for example, a law may state that the SIR for each facility or each infection type must be provided in the public report).
Advisory Board Recommendations
In all states responding to our study, there is an advisory board comprised of stakeholders that typically include healthcare experts, government executive/legislative officials, and consumer advocates. We call these groups “HAI Advisory Boards,” though they go by different names in their respective states.
Eleven states have laws that allow varying degrees of autonomy for their HAI Advisory Board to determine report content. Four states said their board makes recommendations to the legislature, which can amend the law. Three states noted the law specifies the infections to be reported but authorizes the board to exercise its own judgment if something more needs to be added.
Consumer Feedback
Twenty-five states have at least one consumer on their HAI Advisory Board—even though only seven of the states had laws requiring consumers to be included. HAI Coordinators in at least 15 states said the consumer on their board provides advice on report design.
Nine states used consumer focus groups to provide feedback on report design. One HAI Coordinator shared their process specifics: An outside consultant was hired to facilitate two panels of consumers—one panel whose highest educational degree was high school, the other with college-educated consumers. Each panel was shown four HAI report templates and asked to provide positive and negative feedback on each one. The final report design reflected the positive aspects of each template, as indicated by consumers.
Although consumer input in the design process occurred in most states, very few shared that they had a mechanism in place to measure whether the general public was using or understood the reports. There were some voluntary efforts such as monitoring online traffic to the HAI website, but no state laws stipulated that any type of measurement process was required of the coordinator or advisory board. As one coordinator noted, legislating the measurement of consumer understanding would be difficult – it would require the law to specify testing methods for all population demographics and establish benchmarks or goals for understanding.
Relationships Among Law, Advisory Boards, and Consumers in Decision-Making
|
Designing an HAI website is a juggling act. A website/report designer must take into account the requirements of state law, the need for accuracy and completeness, understandability to different audiences, and the overall complexities of reporting information on complicated subjects such as HAIs. Some states have designed interactive websites to communicate information about HAIs to consumers. In these websites, you enter your ZIP code or click on a map, and results (presented as symbols on a map, or a customized table of nearby hospitals) appear. Other states rely on static reports that can be downloaded from the state’s website. Interactive websites don’t always earn the highest ratings, particularly if explanations are hard to find behind all the design features. Some state agencies require that the HAI website have a look and design similar to other agency websites. Web page formats designed for healthy eating or flu shot announcements may not work well for a more complex topic such as HAI reporting. Websites evolve. States have redesigned their websites and reports to incorporate new information, and present the same information in different ways. However, these changes do not always improve the accessibility and usability of the information (Hyman & Black, 2013). Sometimes, the redesign results in more complexity or removes useful information. There is a large opportunity for state agencies to invest in website design, including obtaining consumer input on what works, and does not work, in the current design. The more effective the website, the greater the potential impact of the HAI reports on consumer decisions. |
Decision-making culture can impact report content. For example, regarding one state’s report design, the HAI Coordinator noted that the law provides for every detail; the advisory board has no autonomy to determine report content and, therefore, exercises caution with any creativity in making the reports understandable. For their advisory board, strict adherence to the law (which specifies what will be reported, how often the data is disclosed to consumers, and even what funding sources must be tapped for the reporting process) protects the state in the event of a consumer lawsuit.
In an opposite example, another state HAI Coordinator took a less stringent viewpoint as the law allowed for coordinator/board initiative for improvement. The law required reporting of surgical site infections for a procedure that is typically performed only in large urban hospitals for comparison across all hospitals. But not all reporting facilities perform these surgeries. The advisory board identified a measure of infection prevention compliance that would be a surrogate for HAI rates and applies to all hospitals, whether they perform that surgery or not. Now, that state’s public report includes surgical infection rates and prevention compliance; the law is satisfied, and consumers have at least one measure to compare all hospitals across their state.
And although laws may require consumer membership on advisory boards, the degree of consumer input often is left to the board. For example, use of consumer panels in report design depended largely on the initiative taken by the coordinator or boards, with funding availability as a likely influence.
Ultimately what consumers see in their state HAI reports is driven by the detail the law specifics, the autonomy and initiative exercised by (or allowed for) the advisory board, and activities that drive consumer input.
Public Awareness Efforts to Promote the Reports
After asking how report content is determined, we asked HAI Coordinators how their state promotes these reports. Fifteen said their states put out press releases, three conduct press conferences, and one uses an RSS (Rich Site Summary) newsfeed to subscribers. Most suggested their publicity is generated at the time a report or reporting website was updated, typically once a year.
Upon the release of one state’s first report, a joint press conference was conducted with state government and hospital quality officials. At the press conference, speakers explained the impact of HAIs, where to find more information on them, and how to use the information in their state public reports to avoid HAIs.
Another state enlisted the help of local consumer associations and business coalitions by speaking to their leadership and providing information that the association leaders and publicity chairs could post in newsletters and announcements to their constituents.
Our research team asked about the use of social media to instruct consumers on where to find and how to use HAI information, given recent research that indicates social media play an increasingly larger role in consumer healthcare decisions (PriceWaterhouseCoopers, 2012). Four HAI Coordinators said their states use Facebook, three use Twitter. One coordinator noted the difficulties in using social media to disclose information regarding health and safety topics. Their state prohibits public employees from making social media announcements other than those that originate from official public relations channels. Even if they can obtain authorization, HAI-related announcements will share an already crowded media atmosphere.
The Opinions of Hospital Infection Experts
Hospital epidemiologists and infection preventionists (IPs) are at the frontline of infection prevention. HCW compliance training, monitoring, and outbreak containment are constant concerns. HAI data collection and reporting responsibilities are commonplace. These professionals often are responsible for ensuring compliance with state HAI reporting requirements and are also the ones most likely to be involved in the design of local HAI education and training efforts. Therefore we look to them for insight on the consumer awareness and use of state-mandated HAI reports.
Infection Preventionists
We took a sample of IPs, one from each reporting state, and in phone interviews asked them where a consumer would get information on HAIs as disclosed by state law and how useful they thought this information was. All cited state websites as the places where the public can find HAI information, with two citing newspapers as additional sources.
Most IPs were skeptical about the value of public reports. Most noted that reporting processes are labor intensive and a large majority thought consumers find reports confusing or they are not using them at all. IPs that thought reports were a good idea also acknowledged they were hard to implement. Only one IP’s state has a public awareness campaign to raise awareness of the reports; the rest said either their state had no awareness campaign or they were not sure if one existed (we know from the state interviews that very few have been implemented).
As the responses from IPs were categorized in areas of use and usefulness to consumers, public reports did not emerge as sources of information for the IPs themselves, most likely due to data reporting and processes more specific and timely for internal infection tracking.
| What We Know | Action for Improvement |
| Awareness. Most people who live in states with reporting laws are unaware that HAI reports exist. |
|
| Use. Even if they are aware of the reports, people are not using them or they do not intend to use them in a future hospital decision. |
|
| Knowledge Sources. Consumers’ knowledge of HAI information comes most often from physicians or other healthcare providers. |
|
| Availability. State HAI reports are freely available online. |
|
| Acceptance. Healthcare infection experts have mixed opinions on state HAI reports’ usability and usefulness to the public. |
|
| Decision-Making. HAI rates are not an important factor to most consumers when choosing a hospital. |
|
Epidemiologists
Our team surveyed epidemiologists via an Internet survey through the Society for Healthcare Epidemiology in America’s Research Network. The epidemiologists’ views were consistent with those of their IP colleagues. On a 1 (low) to 5 (high) scale, epidemiologists ranked consumer use of reports as 1.76, understanding of reports as 2.42, and whether HAIs were an important factor when choosing a hospital as 2.37 (McGuckin et al., 2013a). Ninety-one percent said their hospitals do not engage in public awareness campaigns related to HAI reports. Epidemiologists were mixed on how to improve reports. Most suggestions were for longer reports with more comprehensive explanation of the data. However, the second most common suggestion was to simplify the already-too-complex reports. Many suggested that data reporting can be confusing to the average consumer (McGuckin et al., 2013a).
It is safe to say that from an infection expert perspective, there is real doubt about the usefulness or understandability of reports for consumers, and public awareness campaigns are almost non-existent. In their view, state HAI reporting has a long way to go to reach the point where it usefully conveys information and engages consumers.
Do Consumers Know About and Use Reports?
Having learned how reports are created and how infection experts regard them, our group surveyed consumers on their awareness of reports, use of them, and intent to use them in the future. We interviewed 3,031 consumers in the “lower 48” United States using Opinion Research Corporation’s CARAVAN random telephone survey method; of that survey group, 1,895 people lived in states that had public reports at the time of the survey. Overall, consumer awareness and use of state-mandated HAI public reports is not high (McGuckin et al., 2013b).
Just over a quarter of all respondents were aware that laws on public HAI reporting exist (28%). They are made aware by their physician or other healthcare worker (46%), or from printed news media (45%), Internet (35%) or radio/TV (34%).
Recently hospitalized respondents in states with reports, who are more likely to have discussed HAIs as part of the hospital admission process, reported they learned about HAI rates from their physician or other HCW (58%), from the hospital (49%), or from official state reports (38%).
Table 1 summarizes consumer awareness of HAI reports, use of the reports, and intent to use them in future decisions, for various demographics. Women, older-aged adults, and people who had a prior HAI are more likely to be aware state HAI reports exist, use the reports, and indicate that they will use state reports in the future when faced with a healthcare decision. Other demographics such as income and education level show mixed results in the degrees of awareness, use, or intent.
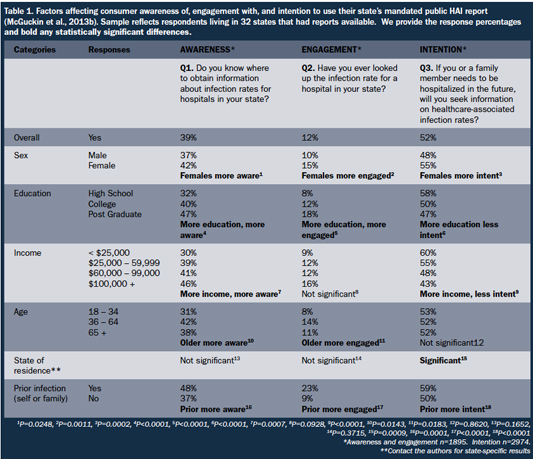
(Click here to view a larger version in another window.)
When given a list of factors considered for choosing a hospital, physician recommendation, reputation, and insurance were identified more frequently by consumers than a hospital’s infection rate as top priority of factors in their decisions. Even when a respondent had prior hospitalization, only 20% said they would consider HAI rates a top priority factor when choosing a hospital in the future. Because HAI rates rank well below a number of other factors, they may not influence actual choice in many instances.
Getting the Message to Consumers
To our knowledge, this is the first systematic study of consumer awareness and use of state-mandated HAI reports, as well as consumer input in the report design process. Although states are mindful of including consumers in report design, we find low levels of awareness and use among the general public. Much remains to be done if public reporting is to fulfill the hopes and expectations of its proponents.
In our interviews with state HAI Coordinators, suggestions for improvement were noted. One common theme was limited funding. Ongoing reporting and disclosure schemes need a reliable budget that will not disappear from one fiscal year to the next, which allows for public awareness campaigns and ongoing effort devoted to improving report and website design. As one coordinator said, an interactive website is on his priority list. But once it is created, he will have to find funding for updates to the website for every reporting cycle.
Another theme from the interviews was to develop a toolkit for HAI Advisory Boards that could apply across reporting states, with a proven methodology and actionable steps for report design, incorporating consumer input, measuring consumer understanding, and developing outreach programs, so that every HAI Coordinator and board is not trying to pioneer a process. Groups such as the Council for State and Territorial Epidemiologists offer avenues for collaboration—many of their members participated in our HAI Coordinator interviews and shared their enthusiasm for improving consumer awareness and use of reports.
The following three focus areas serve as follow up steps to engage consumers:
Focus 1: Partner with Physicians and Other HCWs
Since more consumers cite their physicians or other HCWs than any other sources for HAI information, a targeted effort by states to encourage physicians to discuss HAIs with their patients has the potential to reach many people. A toolkit or other easily accessible resource for physicians can make the process uniform and current to the state’s latest reporting format.
Focus 2: Enlist a Consumer Champion
Consumers who are already aware of HAI rates and where to research them can act as role models and promote the use and understanding of HAI reports within their peer networks. Those who have shown relatively more awareness and engagement with HAI reports include women, people of mature age, and people who have experienced prior HAIs. Outreach, support or social groups—in-person or online social media—may result in identifying champions who can lead by example.
In the book The Patient Survival Guide – 8 Simple Solutions to Prevent Hospital- and Healthcare-Associated Infections, McGuckin & Goldfarb (2012) interviewed several consumers who became champions after contracting an HAI. One example discussed in the book is Kerry O’Connell’s story about his own HAI. O’Connell required multiple surgeries to repair a damaged elbow and forearm, during one of which he acquired an HAI and had to endure additional surgeries to treat the infection. After many months of treatment and recuperation, O’Connell put his experiences to good use as an advocate for healthcare quality and patient awareness. Today, he is the consumer representative for the state of Colorado’s HAI Advisory Board (Colorado Department of Public Health and Environment, 2013).
Focus 3: Empower Consumers
Most consumers do not regard a hospital’s HAI rate as a high-priority factor when making healthcare decisions. Engaging the consumer has proven potential. McGuckin and colleagues (2006) found that 80% of consumers want to know more about HAI information. An open invitation!
Popular media has embarked on hospital quality reporting using HAI rates or related data. Consumer Reports has published its own hospital ratings (2012). AARP published a list of hospital “safety superstars” (Bogardus 2013) using data from The Leapfrog Group, an organization that promotes healthcare safety, quality, and value. Leapfrog even has a mobile smartphone application, which provides safety scores for hospitals in the application-user’s area. (Gillespie 2012).
Providing general information about HAIs—what they are, how common they are, their emotional and financial toll, and hospital’s ability to prevent them may boost the rank of a hospital’s HAI rate among decision factors that are salient to consumers. Even if public HAI reports had far more visibility than they do, they are unlikely to create much demand-side competitive pressure for healthcare quality improvement unless the public is more knowledgeable about HAIs and their prevention.
In Summary
To be empowered to make informed decisions, consumers need knowledge and skills. Using HAI rates as criteria for healthcare decisions is an example. State-mandated HAI reports have the potential to bring this information to consumers. More efforts can be focused towards informing the public that reports exist, where to find them, and how to understand and use the information.
John Govednik is the program manager for McGuckin Methods International (MMI), a listed Patient Safety Organization with the AHRQ, and serves as co-principal investigator for the consumer awareness studies. He may be contacted at govednik@hhreports.com and via www.linkedin.com/in/johngovednik.
Maryanne McGuckin is president of McGuckin Methods International (mcguckinmethods.com) and is a SHEA Fellow. She has 30 years of faculty/staff experience at the University of Pennsylvania in infection control and hospital epidemiology and authored The Patient Survival Guide: 8 Simple Solutions to Prevent Hospital- and Healthcare-Associated Infections. She may be contacted at maryanne@mcguckinmethods.com (current) or mcguckin@hhreports.com.
Jessica Bunson has a 30-year career in infection prevention, serving acute care hospitals, child care services, community nursing services, nursing homes, school nursing, physician office practices, and legal consulting. She may be contacted at bunson@verizon.net.
David Hyman is the H. Ross and Helen Workman Chair in Law and Professor of Medicine at the University of Illinois, where he directs the Epstein Program in Health Law and Policy. He can be reached at dhyman@illinois.edu.
Bernard Black is Nicholas D. Chabraja Professor at Northwestern University. A graduate of Princeton University, the University of California, Berkeley, and Stanford Law School, his principal research areas include healthcare and medical malpractice. His books include To Sue is Human: A Profile of Medical Malpractice Litigation (forthcoming 2014, with David Hyman, William Sage, and Charles Silver.) He can be reached at bblack@kellogg.northwestern.edu.
References